Relations Charts
Relations charts let you explore statistical data on a user’s protocol-related activities through interactive graphical visualizations of data collected into audit and shadow logs, including the deleted shadow data log. These reports are displayed in the form of graphs. Graphs use data types such as instant messenger chats, files transferred through instant messengers, calls, social network chats, e-mail messages and attachments, and are generated for the following protocols: IBM Notes, ICQ Messenger, IRC, Jabber, Mail.ru Agent, MAPI, Skype, SMTP, Social Networks, Telegram, Viber, Web Mail, WhatsApp, and Zoom. However, relations charts may not reflect deleted shadow data specific to the size of file transferred through instant messengers and e-mail attachments.
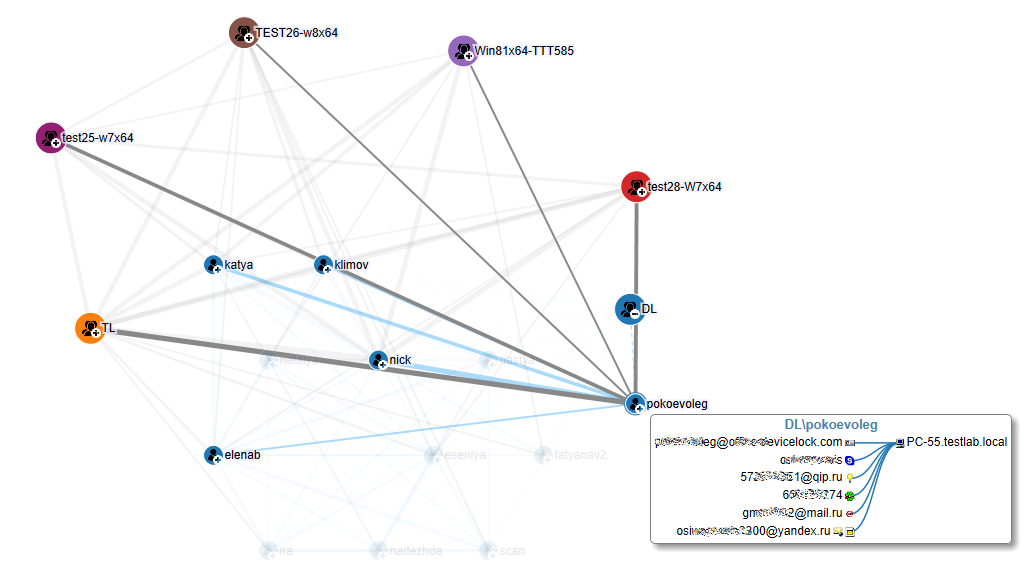
Graphs are composed of two main components: nodes (participants) and lines. A node represents an Active Directory (AD) object, such as a domain, an organizational unit (OU), or a user. A line represents a connection or relationship between two nodes. Connections between two nodes (participants) are calculated based on the total number of instant messenger chats, files transferred through instant messengers, calls, social network chats, e-mail messages, and e-mail attachments between them. Thin lines indicate a weak communication relationship, while thick lines represent a strong communication relationship.
When you point to a line, a pop-up window displays information about a relationship between the connected nodes. This information includes a communication channel (for example, Skype, MAPI), the direction of communication (incoming/outgoing), the total size of the data and files transferred, and the number of connections (such as instant messenger chats, files transferred through an instant messenger, Skype calls, social network chats, e-mail messages, and e-mail attachments) per channel.
Graphs use a hierarchical structure. The top-level nodes represent your organization’s domains. All top-level nodes have different colors. Clicking the plus sign (+) at the bottom right corner of a top-level node displays lower-level nodes representing users that are members of this domain. All lower-level nodes have the same color as the respective top-level node, making it easy to visually identify users from the same domain. Clicking the plus sign (+) at the bottom right corner of a user node displays this user’s identifiers (such as e-mail addresses, social network and instant messenger IDs) and connections with other users. When a node is expanded, clicking the minus sign (-) collapses it.
When you point to a user’s node, a pop-up window displays information about this user. This information includes the user’s name in the following format: DOMAIN\UserName (for example, DL\katya), the name(s) of the user’s computer(s), and the user’s identifiers (such as e-mail addresses, social network and instant messenger IDs).
There are two types of users: internal and external. Internal users are inside the corporate network and are members of your organization’s domain, while external users are outside the corporate network and are not members of your organization’s domain. External users are identified by e-mail addresses, social network IDs, and instant messenger IDs.