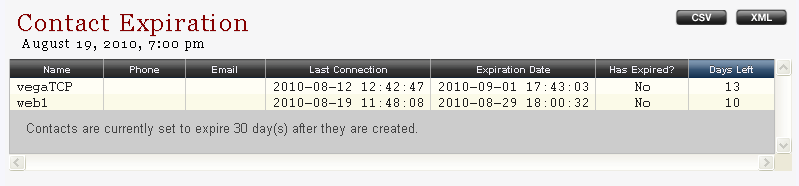
Note: In order to be able to see this report, the New contacts expire after __ days setting needs to be enabled by the administrator of the MassTransit server in the Special tab of the Setup window from the MassTransit Administrator application.
The Contact Expiration report displays a complete list of contacts that have expired or will expire in the next 30 days.
If you click on any of the column titles, the information in the table will be sorted by that column.
If you click on the CSV or XML button, you will be able to open/save the report in a *.csv or *.xml file format.
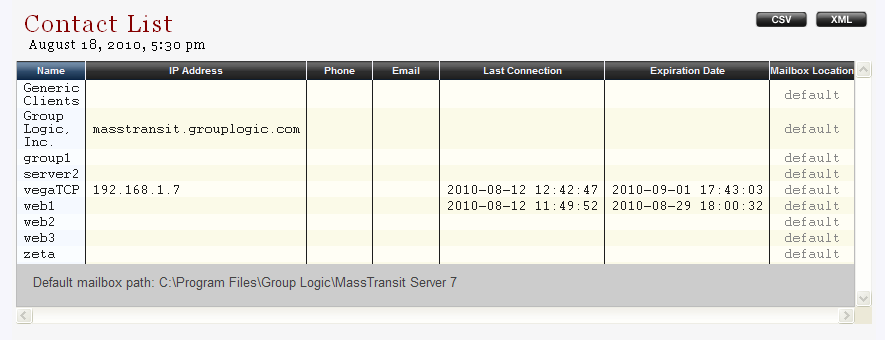
Contact List
The Contact List report displays a complete list of contacts with configuration information about the contacts' IP addresses, phone, email address, time of last connection, expiration date (if configured), and mailbox location.
If you click on any of the column titles, the information in the table will be sorted by that column.
If you click on the CSV or XML button, you will be able to open/save the report in a *.csv or *.xml file format.
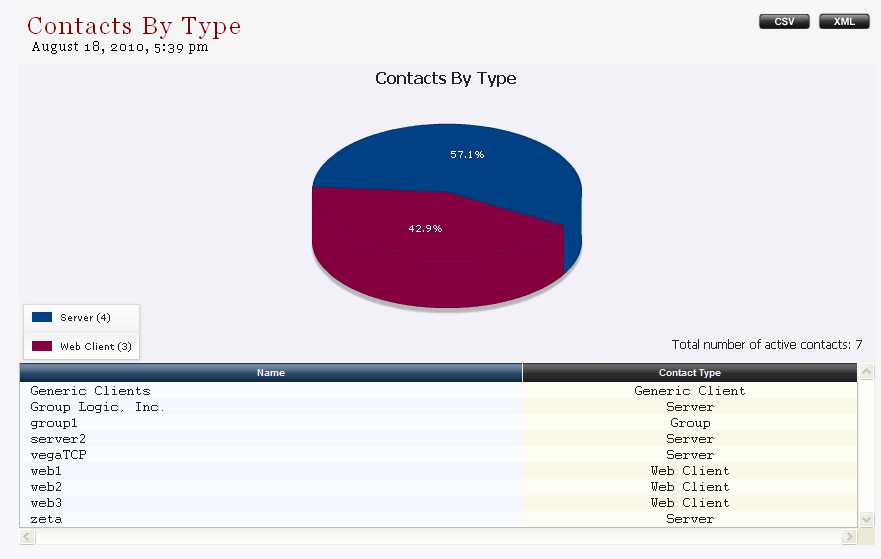
Contacts by Type
The Contacts by Type report lists all active contacts and their type. The report also displays a graph with the active contacts by type.
If you click on any of the column titles, the information in the table will be sorted by that column.
If you click on the CSV or XML button, you will be able to open/save the report in a *.csv or *.xml file format.
To save only the chart, right click on it and select the Save as image... option. Then, select a location to save the image and click OK.
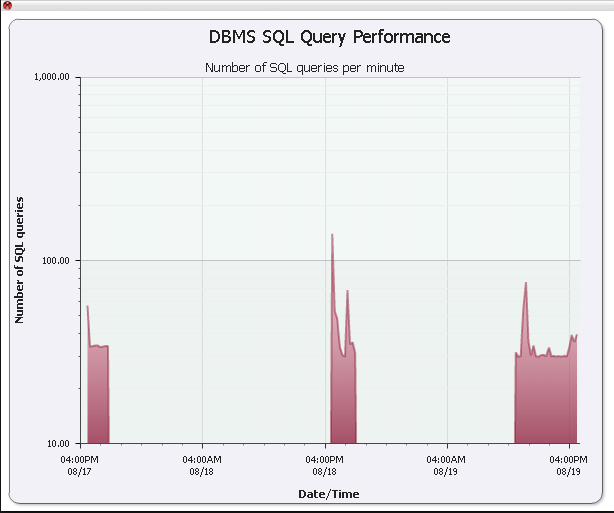
Database Analysis
The Database Analysis displays detailed analysis of DBMS performance, memory usage, and configuration. There are the following sections with database analysis:
General analysis – DBMS type, version, etc.; if you click on the chart icon in the bottom right corner, a "DBMS SQL Query Performance" graph will be displayed showing the number of SQL queries per minute (to close the graph, click the red x in the top left corner):
Slow Queries – shows slow query log and time, and number of slow queries on the server if there are any; analysis of slow query;
Query Cache – shows cache size and analysis of the query cache;
Memory usage – displays the values in Megabytes (MB) of the following parameters: largest amount of memory ever allocated, configured maximum memory per thread, configured maximum size of global buffers, configured maximum system memory requirement, and physical RAM installed in server; shows also analysis of the memory usage;
Key buffer – displays the values of the following parameters: current MyISAM index space in MB, key cache miss rate, key buffer size in MB, key blocks used, key blocks unused, and key buffer fill in percents; analysis of the key buffer;
Table Scans – displays the values of the following parameters: read buffer size in KB, current full table scan ratio; information whether the read buffer size is OK;
Temporary Tables – displays the values of the following parameters: temporary table size in MB, maximum memory-based temporary table size in MB, total number of temporary tables created, total number of disk-based temporary tables created; analysis of the temporary tables;
Table Locking – displays the values of the following parameters: immediate table locks, table locks waited, immediate to wait ratio, concurrent INSERTs, low priority UPDATEs ON/OFF; analysis of the table locking.
If you click on the CSV or XML button, you will be able to open/save the report in a *.csv or *.xml file format.
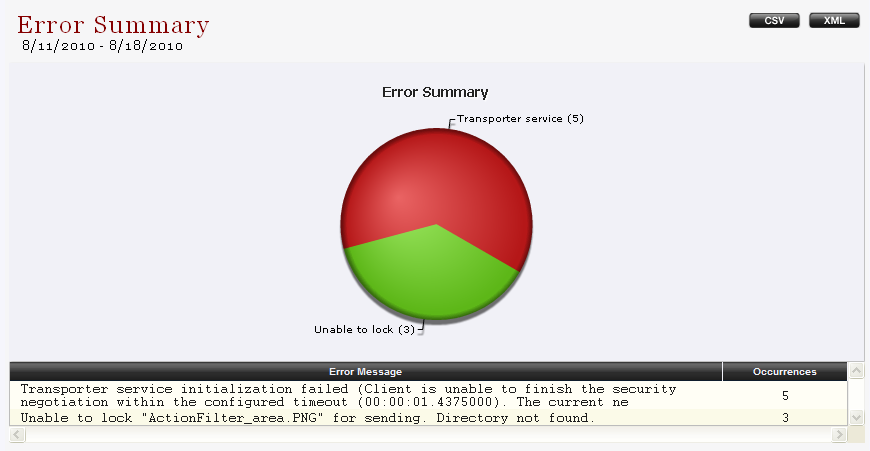
Error Summary
The Error Summary displays file transfer and connection errors grouped by error. The report also displays a graph of the errors by type.
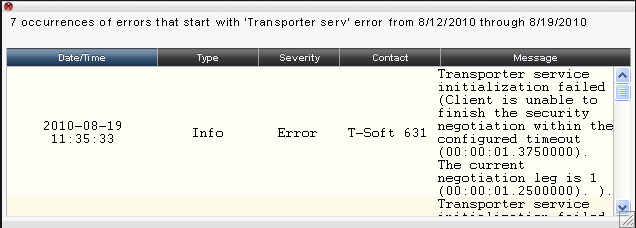
If you click on the circle graph, a list will appear with detailed information about the error occurrences (to close the list, click the red x in the top left corner):
In addition, you can filter the displayed information by the following options from the Report Parameters section:
Start Date – enter or select a start date from the calendar to filter the errors starting from the chosen date; you can also add/subtract the year or the month in the field by clicking on the corresponding buttons below it;
End Date – enter or select an end date from the calendar to filter all errors to the chosen date; you can also add/subtract the year or the month in the field by clicking on the corresponding buttons below it;
Common Dates – this drop-down menu has options for faster filtering by the period that is selected; these are the available options:
Today;
Yesterday;
Last 7 Days;
Last 14 Days;
Last 30 Days;
Last 365 Days;
Year To Date;
Previous Month;
Last Year.
When you have set the desired report parameters, click on the Run Report button to generate a report according to the selected parameters.
If you click on the CSV or XML button, you will be able to open/save the report in a *.csv or *.xml file format.
To save only a chart, right click on it and select the Save as image... option. Then, select a location to save the image into and click OK.
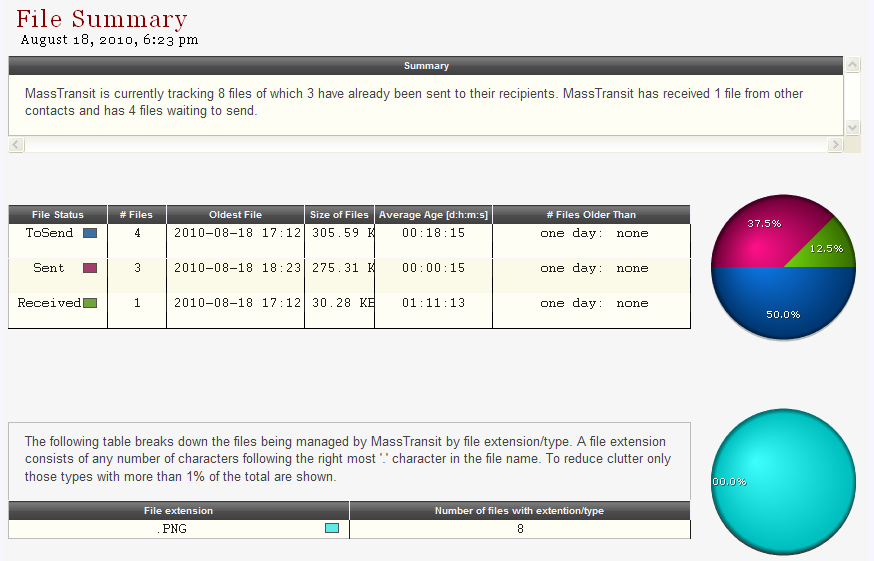
File Summary
The File Summary displays a high level view of files in the system including number and size of files to send, sent, and received. You can also see information about the transferred file types.
To save only a chart, right click on it and select the Save as image... option. Then, select a location to save the image into and click OK.
Server Summary
The Server Summary displays a high level view of MassTransit server configuration and status. This report includes the following sections:
MassTransit Server – displays information about the following parameters of the MassTransit Server: server name, server location, MassTransit Engine version, uptime in percents, last restart, previous shutdown, current uptime, SOAP interface version, and physical system memory;
Operating System / Web Server / PHP – displays information about the following parameters: operating system, computer name, DNS domain, user name of the user that MassTransit is run under, name of the server MassTransit is installed on, web server name and version, virtual directory support enabled/disabled, HTTP host, PHP version, path to the php.ini configuration file, value of the display_errors setting in PHP, value of the log_errors setting in PHP, value of the magic_quotes_gpc setting in PHP, value of the max_input_time setting in PHP, value of the memory_limit setting in PHP;
MassTransit Database – displays information about the following parameters of the MassTransit Database: type of the database, database version, database host, name of the user that MassTransit uses to connect to the database, MassTransit's database name, database query file name, database query file version, name of the override file of the database query file, database query override file version;
MassTransit Licensing – displays information about: identification number of the dongle, dongle flags, limit of the capacity model, installed licenses;
MassTransit Mailboxes – displays information about: default mailbox path, percents free space in the default mailbox disk, path to the default database, percents free space in the default database disk;
MassTransit Remote Administration – administrator address, port number for administrator notifications, port number for administrator requests, number of maximum connections allowed;
MassTransit Purging – displays information about: whether log purging is enabled, log purging duration, whether file purging is enabled, file purging duration;
mtweb.ini settings – displays the set values of the following settings of the mtweb.ini configuration file: MTWEB_MODE, LOGIN_MSG, SERVER_NAME, WATERMARK, LOGVIEWER_MAX_PAGES, LOGVIEWER_MAX_DISPLAYED_PAGES, LOGVIEWER_RESULTS_PER_PAGE, LOGVIEWER_UPDATE_DELAY_SECONDS, LOGVIEWER_24_FORMAT}}, MY_ACCOUNT_TAB_ENABLED, DISPLAY_NEW_JOB_TICKET_BUTTON, MAX_ROWS_TO_SHOW, SOAP_PROXY_ADDRESS, SOAP_PROXY_PORT, SOAP_WSDL, SOAP_TIMEOUT, DB_HOST, DB_PORT, DB_NAME, DB_USER (displayed with asterisk characters only), DB_PASSWORD (displayed with asterisk characters only), REPORTING_DB_USER (displayed with asterisk characters only), REPORTING_DB_PASSWORD (displayed with asterisk characters only), AUTHENTICATE_METHODS, AUTHENTICATION_TIMEOUT, CACHE_CLIENT_DATA, LANG, MEMORY_LIMIT, MFORCEHTMLJOBTICKET, MLIMITNUMFILESPERTRANSFER, LATEST_AVAILABLE_PLUGIN_VERSION, MINIMUM_REQUIRED_PLUGIN_VERSION, PLUGIN_FILENAME_WIN, PLUGIN_FILENAME_MAC, PLUGIN_FILENAME_MAC_10_4, HTTP_TRANSFER_ALLOWED, DEFAULT_FILE_TRANSFER_TRANSPORT, HTTP_STAGING_FOLDER, SECONDARY_DB_HOST, SECONDARY_DB_PORT, SECONDARY_DB_NAME, SECONDARY_DB_USER (displayed with asterisk characters only), SECONDARY_DB_PASSWORD (displayed with asterisk characters only), ACCOUNT_REQUEST_FROM, ACCOUNT_REQUEST_TO, ACCOUNT_REQUEST_SUBJECT, ACCOUNT_REQUEST_BODY, ENABLE_ACCOUNT_CREATION_EMAIL, ACCOUNT_CREATION_SUBJECT, ACCOUNT_CREATION_BODY, ENABLE_DEBUG_LOG, LOG_STACK_TRACE, LOG_CALLING_FUNCTION_FOR_EACH_MSG, LOG_DEBUG_LOG_VIEWER, LOG_SQL_CALLS, LOG_SQL_RESULTS, LOG_EXCEPTIONS, LOG_REPORT_DATA, LOG_CHART_XML, TRACK_MEMORY_USAGE, REPORTING_DB_HOST, REPORTING_DB_NAME, REPORTING_DB_PORT;
MassTransit LDAP/Active Directory Configuration – displays information about LDAP parameters: whether LDAP is enabled, LDAP primary domain, LDAP server address, LDAP server port, LDAP server bind domain name;
Average File Transfer Compression Ratios – displays the following ratios: receive compression ratio, send compression ratio, combined compression ratio.
If you click on the CSV or XML button, you will be able to open/save the report in a *.csv or *.xml file format.