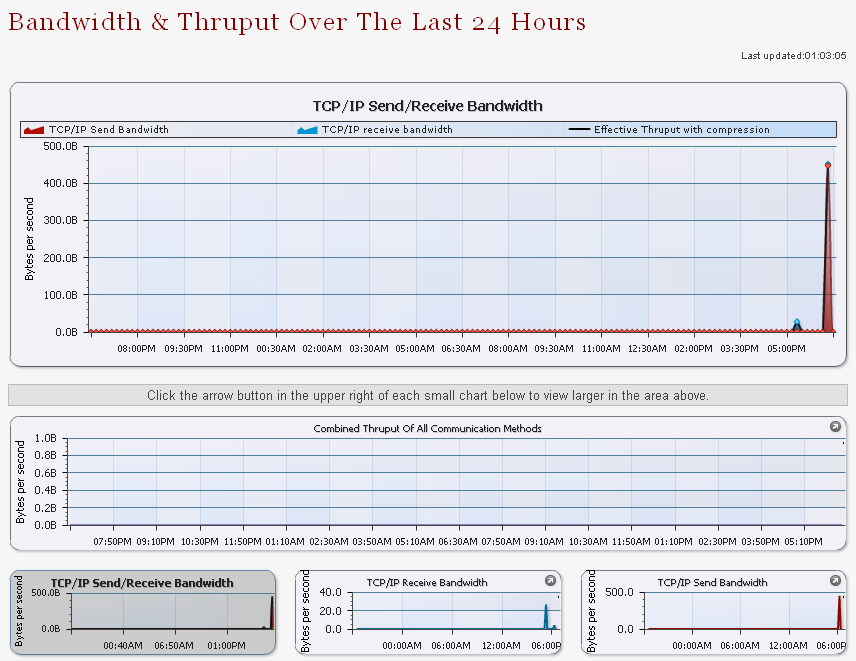
The Bandwidth and Thruput Over The Last 24 Hours report is a comparison of raw network I/O vs. throughput (including compression) during the previous 24 hours.
The available charts in this report are:
If you click the arrow button in the upper right corner of each small chart, you will be able to view it larger in the area above.
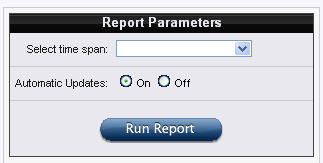
In addition, you can filter the displayed information using the Report Parameters section:
The MassTransit Performance Counters report displays various MassTransit performance counters during the previous 24 hours.
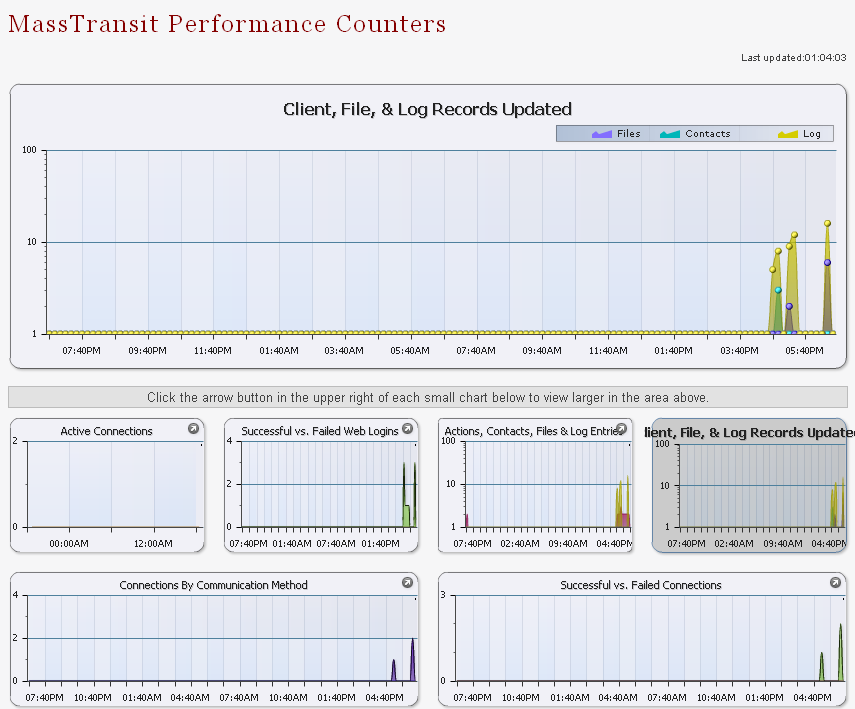
The available charts in this report are:
If you click the arrow button in the upper right corner of each small chart, you will be able to view it larger in the area above.
In addition, you can filter the displayed information using the Report Parameters section:
Select time span – this drop-down menu has options for faster filtering by the period that is selected; these are the available options:
Automatic Updates radio button – when it is on, the displayed information is being updated automatically; otherwise, the information does not update unless you do that manually; in the upper right corner of the report, there is a time stamp of the last update time.
When you have set the desired report parameters, click on the Run Report button to generate a report according to the selected parameters.
To save only a chart, right click on it and select the Save as image... option. Then, select a location to save the image into and click OK.
The Server Performance Over the Last 24 Hours shows an overview of key server functions such as open connections, SQL server performance, and bandwidth usage over the previous 24 hours.
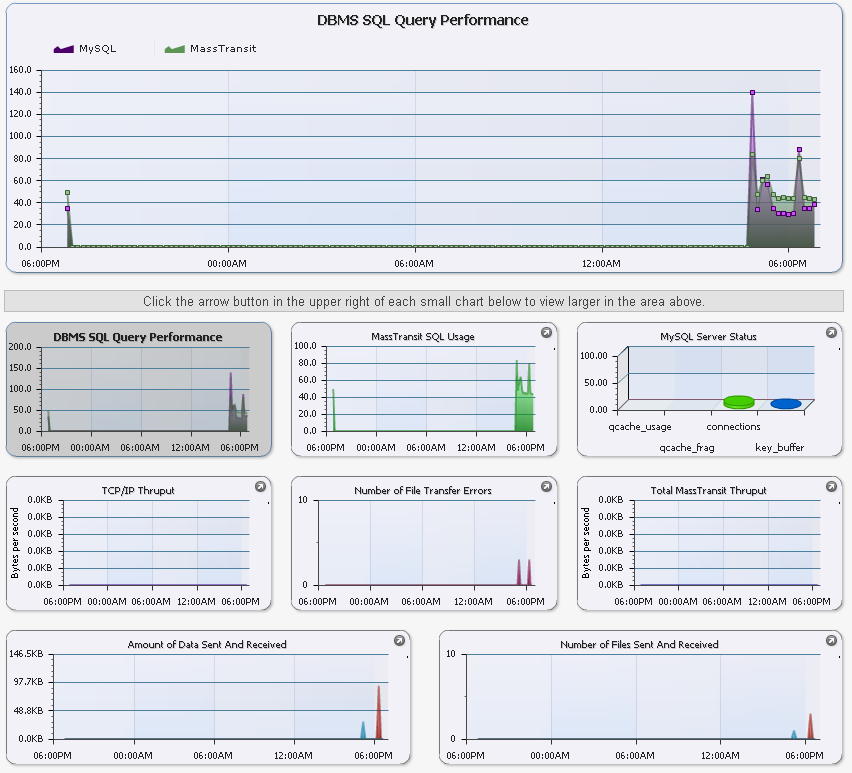
The available charts in this report are:
If you click the arrow button in the upper right corner of each small chart, you will be able to view it larger in the area above.
In addition, you can filter the displayed information using the Report Parameters section:
Select time span – this drop-down menu has options for faster filtering by the period that is selected; these are the available options:
Automatic Updates radio button – when it is on, the displayed information is being updated automatically; otherwise, the information does not update unless you do that manually; in the upper right corner of the report, there is a time stamp of the last update time.
When you have set the desired report parameters, click on the Run Report button to generate a report according to the selected parameters.
To save only a chart, right click on it and select the Save as image... option. Then, select a location to save the image into and click OK.