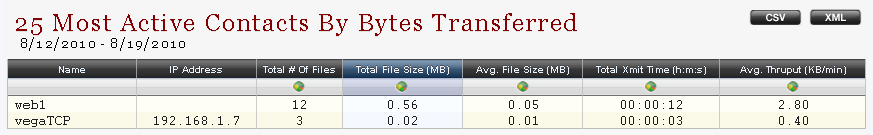
Most Active Contacts by Bytes Transferred
The Most Active Contacts by Bytes Transferred report shows top 25 active contacts based on number of bytes transferred. The report also gives information about: IP addresses of the contacts, total number of files transferred, total file size transferred in Megabytes, average file size transferred in Megabytes, total transmit time (hours:minutes:seconds), average throughput (KB per minute).
If you click on any of the column titles, the information in the table will be sorted by that column.
Clicking on the chart icons that are in the first row of some of the table columns, the information from the column will be displayed in a chart. To close the chart, click the red x from the top left corner of the chart window.
In addition, you can filter the displayed information by the following options from the Report Parameters section:
When you have set the desired report parameters, click on the Run Report button to generate a report according to the selected parameters.
If you click on the CSV or XML button, you will be able to open/save the report in a *.csv or *.xml file format.
To save only a chart, right click on it and select the Save as image... option. Then, select a location to save the image into and click OK.
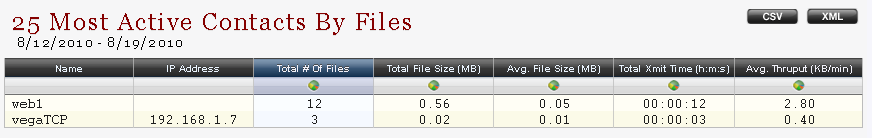
The Most Active Contacts by Files report shows top 25 active contacts based on number of files transferred.
If you click on any of the column titles, the information in the table will be sorted by that column.
Clicking on the chart icons that are in the first row of some of the table columns, the information from the column will be displayed in a chart. To close the chart, click the red x from the top left corner of the chart window.
In addition, you can filter the displayed information by the following options from the Report Parameters section:
When you have set the desired report parameters, click on the Run Report button to generate a report according to the selected parameters.
If you click on the CSV or XML button, you will be able to open/save the report in a *.csv or *.xml file format.
To save only a chart, right click on it and select the Save as image... option. Then, select a location to save the image into and click OK.
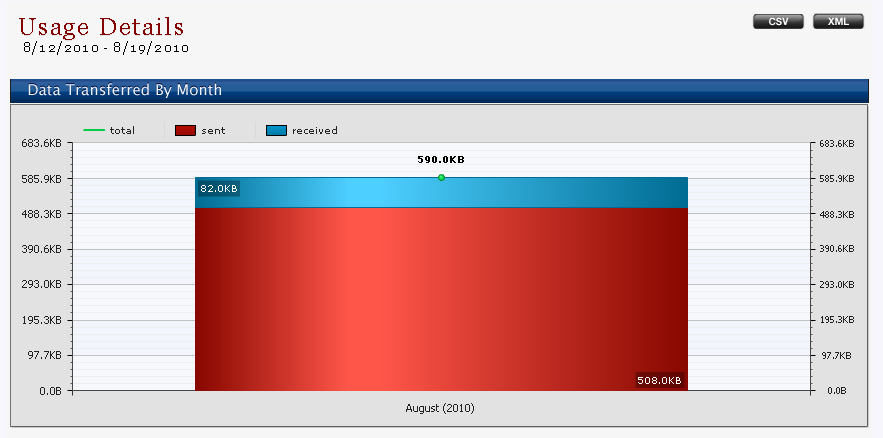
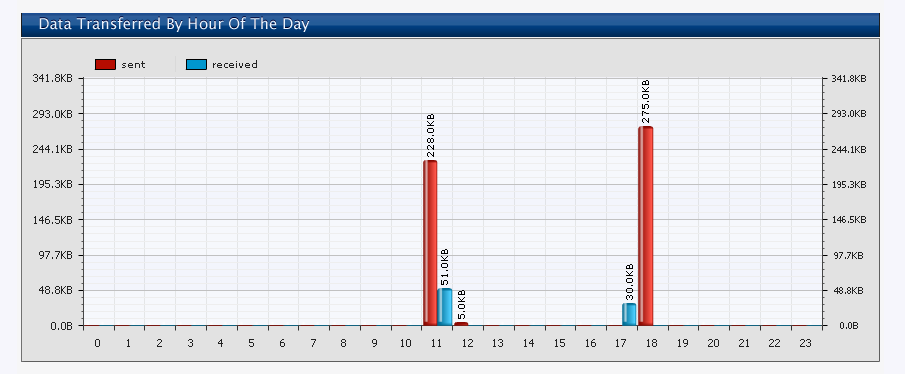
The Usage Details report shows server usage by:
data transferred by month:
data transferred by hour of the day:
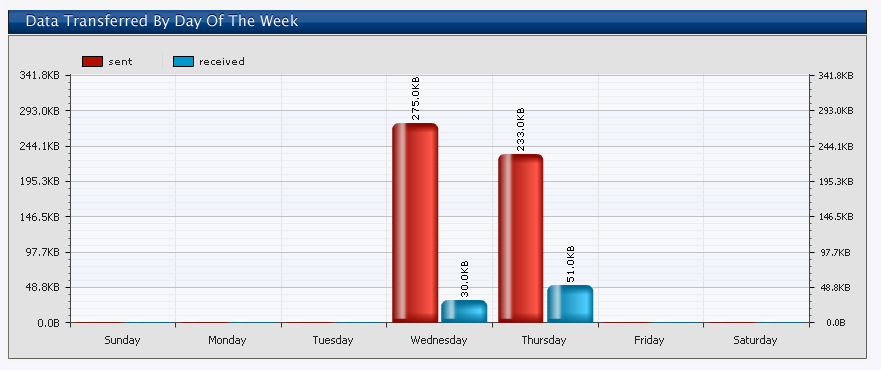
data transferred by day of the week:
In addition, you can filter the displayed information by the following options from the Report Parameters section:
When you have set the desired report parameters, click on the Run Report button to generate a report according to the selected parameters.
If you click on the CSV or XML button, you will be able to open/save the report in a *.csv or *.xml file format.
To save only a chart, right click on it and select the Save as image... option. Then, select a location to save the image into and click OK.