Here you can see all of the recent events (depending on your purging policy, the time limit might be different), the users from which the log originated and a message explaining the action.
Note: If you wish to configure a Gateway Server's logging and level of logging, please visit Gateway Server Logging.
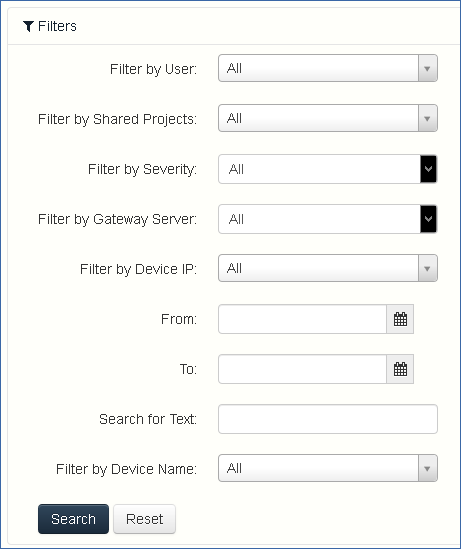
Filter by User – filters the logs by User. You can select All, No user or choose one of the available users.
Filter by Shared Projects – filters the logs by Shared Project. You can select All, Not shared or choose one of the available Shared Projects.
Filter by Severity – filters the logs by type. The types are All, Info, Warning, Error and Fatal.
From/To – filter by date and time.
Search for Text – filter by log message contents.
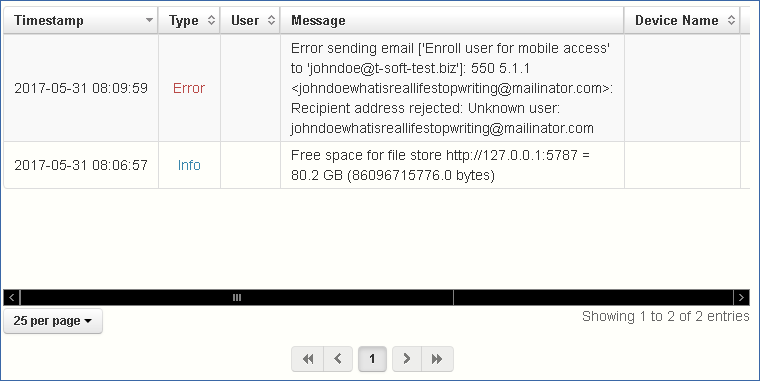
Timestamp – shows the date and time of the event.
Type – shows the level of severity of the event.
User – shows the user account responsible for the event.
Message – shows information on what happened.
If you have enabled Audit logging on a Gateway Server, you will also see the activity of your mobile clients. If you have allowed Desktop and Web clients to access mobile Data Sources, they will also be reflected in the log.
Device Name – name of the connected device.
Device IP – shows the IP address of the connected device.
Gateway Server – shows the name of the Gateway Server to which the device is connected.
Gateway Server Path – shows the path to the data source on that Gateway Server.