Disk health monitoring
Disk health monitoring provides information about the current disk health status and a forecast about it, so that you can prevent data loss that might be related to a disk failure. Both HDD and SSD disks are supported.
Limitations:
- Disk health forecast is supported only for machines running Windows.
- Only disks of physical machines are monitored. Disks of virtual machines cannot be monitored and are not shown in the disk health widgets.
- RAID configurations are not supported.
- On NVMe drives, disk health monitoring is supported only for drives that communicate the SMART data via the Windows API. Disk health monitoring is not supported for NVMe drives that require reading the SMART data directly from the drive.
The disk health is represented by one of the following statuses:
- OK
Disk health is between 70% and 100%. - Warning
Disk health is between 30% and 70%. - Critical
Disk health is between 0% and 30%. - Calculating disk data
The current disk status and forecast are being calculated
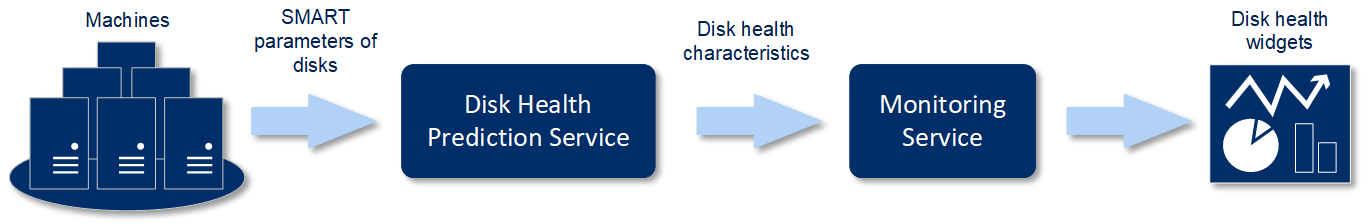
How it works
Disk Health Prediction Service uses an AI-based prediction model.
-
The protection agent collects the SMART parameters of the disks and passes this data to Disk Health Prediction Service:
- SMART 5 – Reallocated sectors count.
- SMART 9 – Power-on hours.
- SMART 187 – Reported uncorrectable errors.
- SMART 188 – Command timeout.
- SMART 197 – Current pending sector count.
- SMART 198 – Offline uncorrectable sector count.
- SMART 200 – Write error rate.
-
Disk Health Prediction Service processes the received SMART parameters, makes forecasts, and provides the following disk health characteristics:
- Disk health current state: OK, warning, critical.
- Disk health forecast: negative, stable, positive.
- Disk health forecast probability in percentage.
The prediction period is always one month.
- Monitoring Service receives these characteristics, and then shows the relevant information in the disk health widgets in the Cyber Protect web console.
Disk health widgets
The results of the disk health monitoring are presented in the following widgets that are available in the Cyber Protect web console.
-
Disk health overview is a treemap widget with two levels of detail that can be switched by drilling down.
-
Machine level
Shows summarized information about the disk status of all machines in the selected organizational unit. Only the most critical disk status is shown. The other statuses are shown in a tooltip when you hover over a particular block. The machine block size depends on the total size of all disks of the machine. The machine block color depends on the most critical disk status found.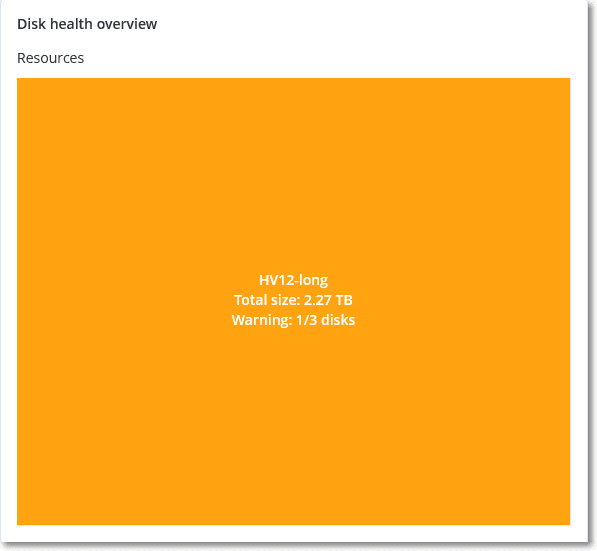
-
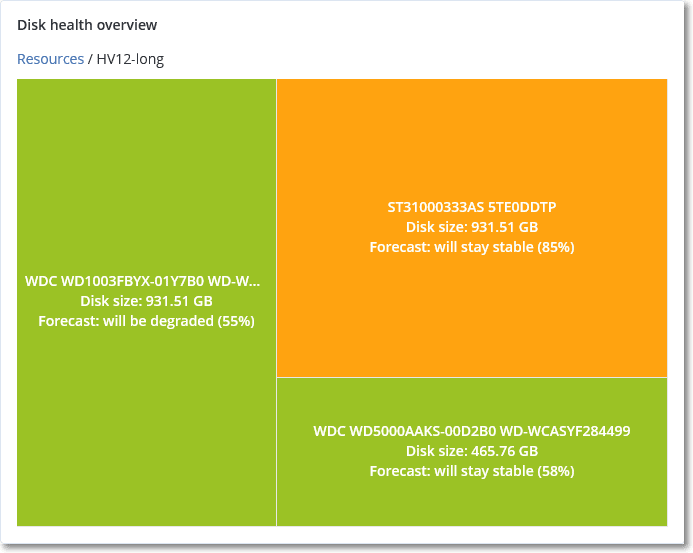
Disk level
Shows the current disk health status of all disks for the selected machine. Each disk block shows one of the following disk health forecasts and its probability in percentage:- Will be degraded
- Will stay stable
-
Will be improved
-
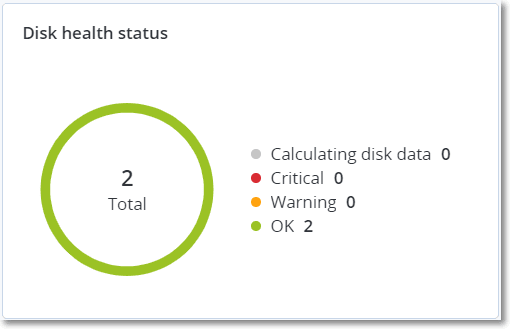
- Disk health status is a pie chart widget that shows the number of disks for each status.
Disk health status alerts
The disk health check runs every 30 minutes, while the corresponding alert is generated once a day. When the disk health status changes from Warning to Critical, an alert is always generated.
| Alert name | Severity | Disk health status | Description |
|---|---|---|---|
| Disk failure is possible | Warning | (30 – 70) | The <disk name> disk on this machine is likely to fail in the future. Run a full image backup of this disk as soon as possible, replace it, and then recover the image to the new disk. |
| Disk failure is imminent | Critical | (0 – 30) | The <disk name> disk on this machine is in a critical state and will most likely fail very soon. An image backup of this disk is not recommended at this point as the added stress can cause the disk to fail. Back up the most important files on this disk immediately and replace it. |