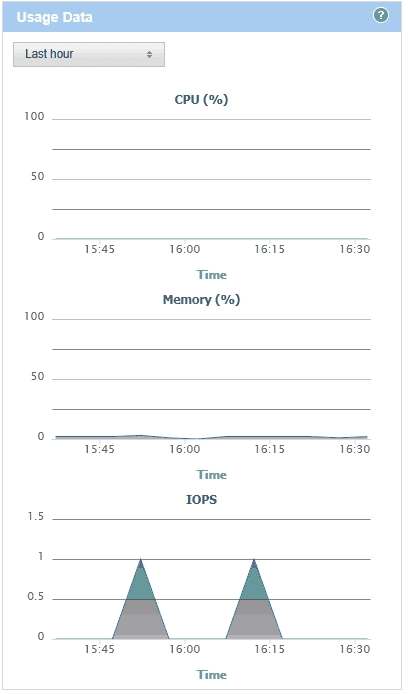
(Server) Usage Data
Location: on the Server Details page.
Access path: Servers tab on the menu bar, drill-down to a single server in the servers list.
Presents recent utilization of CPU, memory, and IOPS by the selected server. This information may be useful in troubleshooting, especially if server is unresponsive.

Available operations:
- Filter the data by selecting a different time period in time drop-down list box.
- Zoom in on a time period by double clicking and dragging the mouse pointer horizontally across part of the graph. You can reset the zoom by clicking the Reset zoom text in the upper right corner of the graph.