Investigating incidents
Endpoint Detection and Response (EDR) enables you to investigate an entire incident, including all of the attack stages and objects (processes, registries, scheduled tasks, and domains) impacted by an attack. These objects are represented by nodes in the easy-to-understand cyber kill chain, as shown below. Use the cyber kill chain to quickly understand what exactly happened, and when it happened.
The Investigate incident action is disabled for transferred incidents.
To investigate the activity that was transferred, open the new correlated incident by using the link provided in the transferred incident's details.
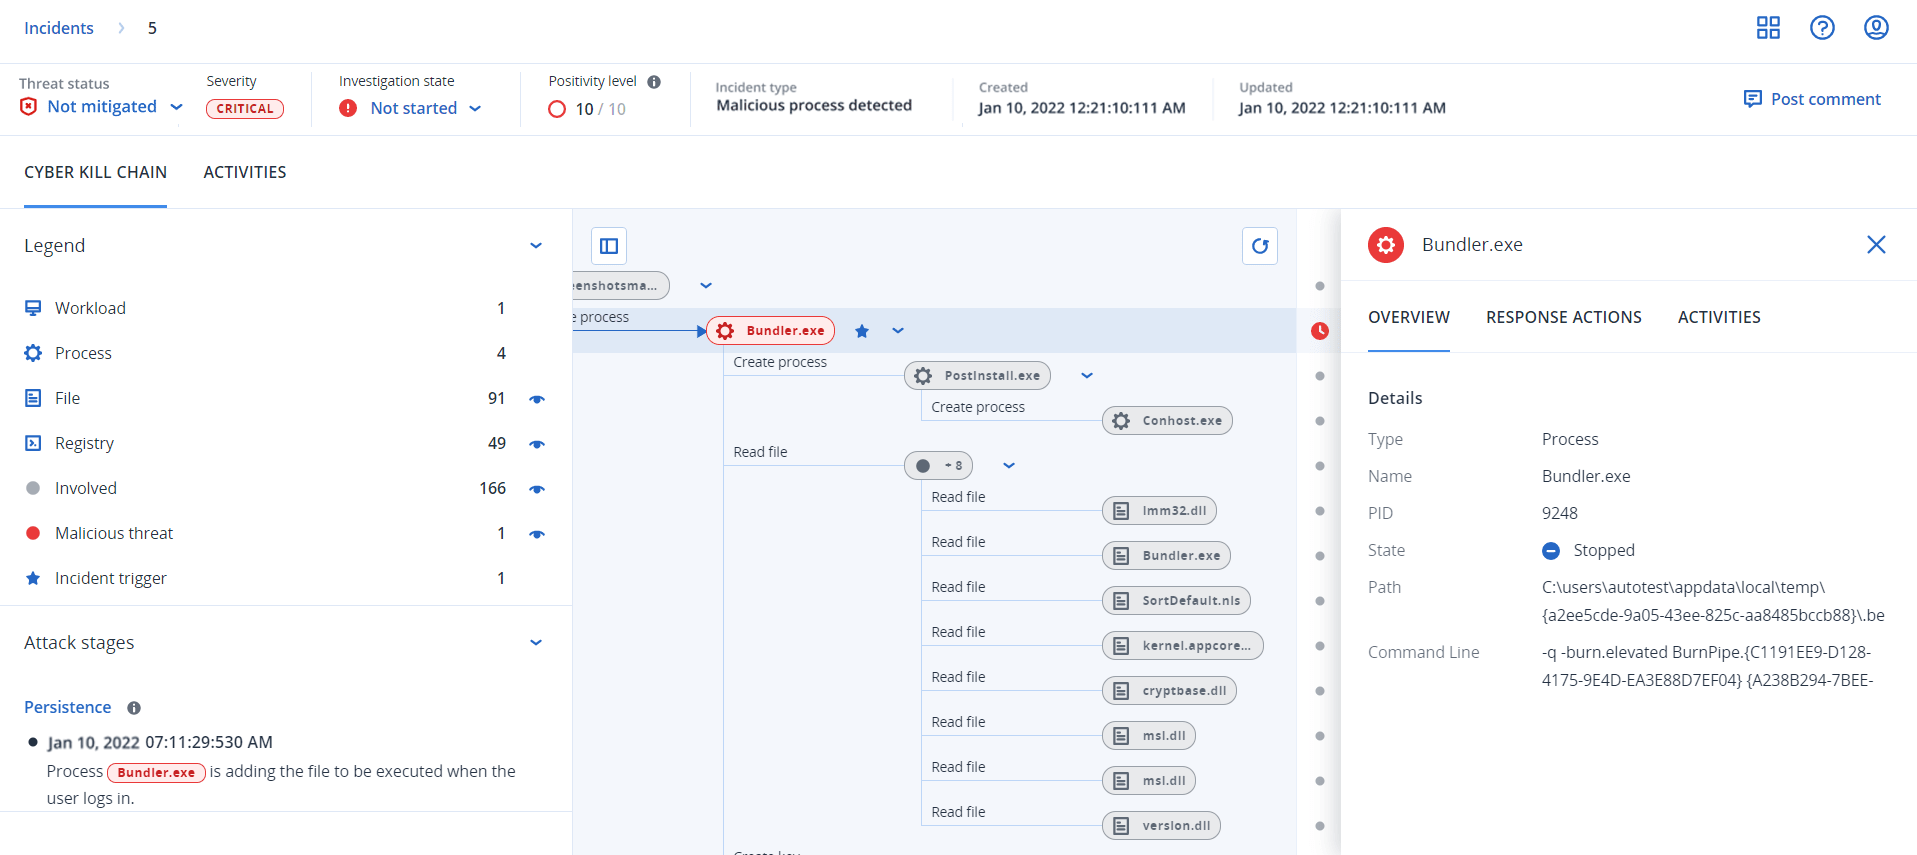
Each and every step of an attack is viewed in the cyber kill chain, which provides you with a detailed interpretation of how and why the incident happened. The cyber kill chain uses easy to understand sentences and graphs that help explain each step of the attack, in turn helping to minimize investigation time.
You can quickly understand the scope and impact of an incident, with the attack evolution mapped to the MITRE framework. This enables you to analyze what happened in each step of an attack, including:
- The initial point of entry
- How the attack was executed
- Any escalations of privileges
- Avoidance detection techniques
- Lateral movements to other workloads
- Credential theft
- Exfiltration attempts
You can also click Copilot to launch the chat with Acronis AI, which enables you to enter multiple requests, and to receive suggested response actions for the selected incident. For more information, see How to investigate incidents in the cyber kill chain.
In addition to the Cyber Kill Chain, each incident includes an Incident Graph — a visual representation of the attack chain showing relationships between the workload, processes, files, network connections, registry entries, and threat detections. The Incident Graph is available to all EDR users and provides an alternative view of the same incident data. For more information, see Working with the Incident Graph (EDR).