






Author: Alexander Ivanyuk, Senior Director, Technology
Executive summary
Backup is often seen as a background control until it becomes the last control available. During disruptions — ransomware, outages or accidental deletions — what matters is whether recoverable points exist, how recent they are, and whether restores can be performed quickly and repeatedly under pressure. CISA recommends keeping offline, encrypted backups and regularly testing their availability and integrity. Microsoft’s ransomware guidance stresses protecting backups and recovery documentation.
This report uses Acronis Cyber Protect H2 2025 global telemetry to show two industry-relevant operational patterns that often separate "backup success" from "recovery readiness":
- Pattern A — The backup window illusion: jobs can succeed but finish late, outside the planned window, quietly reducing effective recovery point objective (RPO) and increasing production contention.
- Pattern B — The managed service provider (MSP) depth trap: deep tenant hierarchies are linked to a step-change increase in failure rate at extreme nesting, reflecting complexity in policy inheritance, role-based access control (RBAC) scope, alert routing and resource coordination.
Three key findings support this analysis:
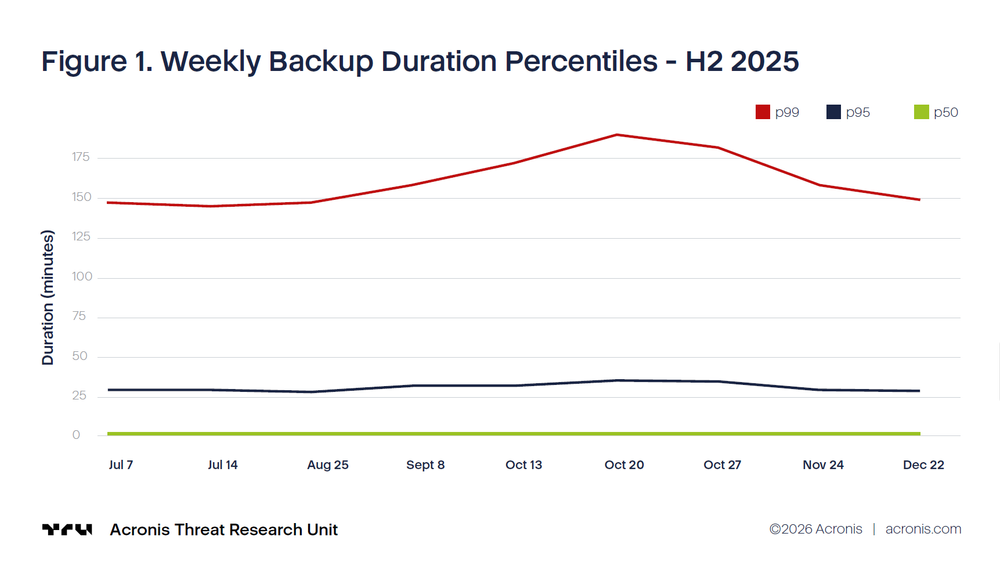
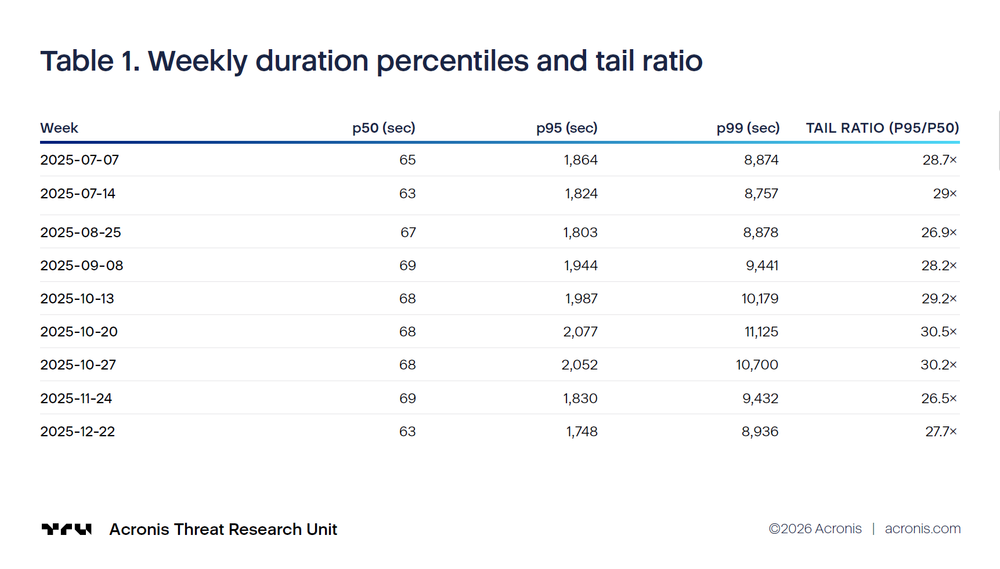
1. Backups can take much longer than people usually expect. In the worst week of the second half of 2025 (the week of October 20, 2025), the slowest 1% of backups took up to 11,125 seconds, or about 185 minutes, including time spent waiting in the queue.
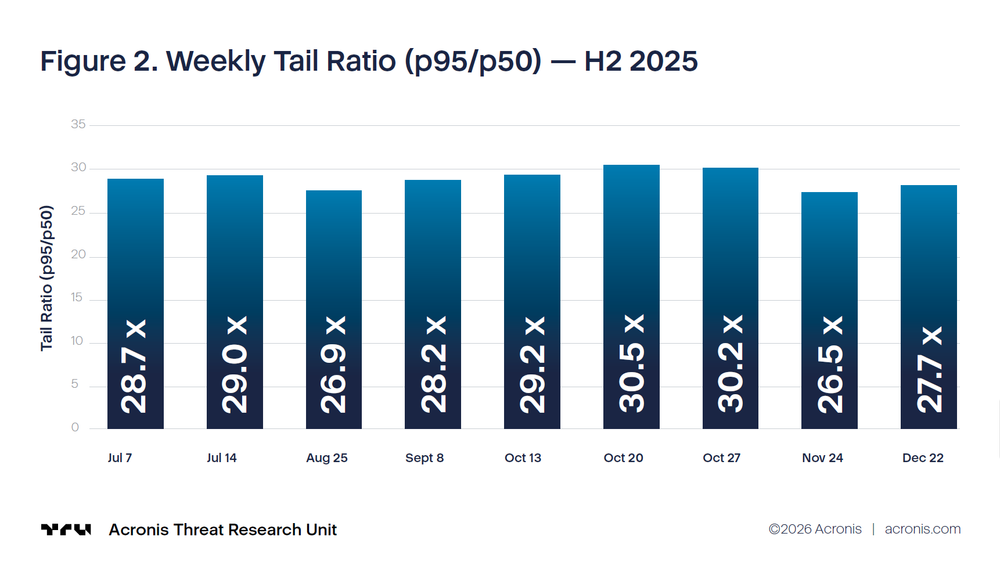
2. The longest-running backups stay consistently much slower than normal ones. Across H2 2025, backups in the top 5% took about 26.5 to 30.5 times longer than the typical backup.
3. Very deep folder hierarchies are strongly linked to more failures. At nesting level 12, the failure rate jumps sharply to 39.78% across 1,076 tenants. That is a major increase compared with level 11, where the failure rate was 9.5%.
For end customers, the practical response is to define measurable recovery outcomes (especially success-in-window), design schedules for tail behavior, and make sure managed-service governance controls complexity and closes monitoring and response gaps.
Why this problem matters now
Three forces have widened the gap between perceived backup health and actual recovery readiness:
Ransomware actors often try to delete or encrypt accessible backups to block recovery. CISA recommends keeping offline, encrypted backups and regularly testing backup availability and integrity in disaster recovery scenarios. Microsoft guidance also notes that ransomware attacks target data, backups and the documentation needed for recovery, and gives steps to protect and validate backups.
Small and medium-sized businesses (SMBs) and midmarket firms increasingly use backup as a managed service. Multitenancy improves operational efficiency, but adds structural complexity around authorization, isolation, inheritance and observability. Azure Architecture Center and AWS multitenant SaaS guidance describe these tradeoffs.
Large-scale systems are shaped by tail behavior: rare slow events can drive overall outcomes. Jeffrey Dean and Luiz André Barroso have explained how temporary high-latency episodes dominate performance at scale. Backup operations show similar dynamics: even if most jobs are fast, some will inevitably be slow every night in a large fleet.
Data, scope and how to interpret metrics
This report is based on aggregated customer backup telemetry for H2 2025 (2025-07-01 to 2025-12-31), covering job outcomes (success / failure), durations, schedule timing, destination classes, encryption / scheme combinations and MSP tenant hierarchy metadata.
Interpretation note: the telemetry reflects many different environments. Variability and failures are expected in any backup ecosystem because outcomes depend on endpoint performance, network stability, permissions, storage throughput, change rates, job size and operational maturity.
Percentiles (p50, p95, p99) describe distributions. The median (p50) shows a typical run and p95 and p99 show the tail. Windows and capacity should be designed for the tail because the tail causes overruns and collisions.
The backup window illusion
The backup window illusion happens when teams assume that scheduling inside a window means completion inside that window. A job can still be marked as successful even if it finishes after the business day begins. That creates hidden exposure: production contention and a protection point older than intended.
Duration distribution: Fast typical runs, long tails
In the worst week of H2 2025 (week 2025-10-20), p99 reached 11,125 seconds (185.4 minutes). Duration is measured from job creation to completion, including queue time — the total elapsed time that determines when a recovery point becomes available.
Across H2 2025, weekly tail ratios (p95 / p50) range from 26.5× to 30.5×. Planning based on medians will systematically make windows too small.
Environment correlates: Destination choice and dependency
Destination choice is linked to both fail rate and p95 duration, which then affects the chance of window overrun and collision.
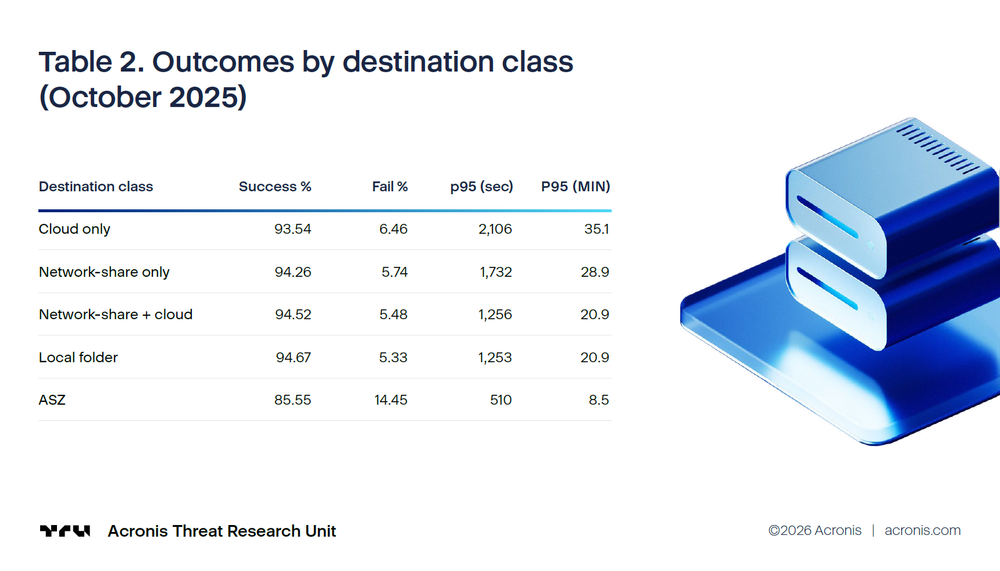
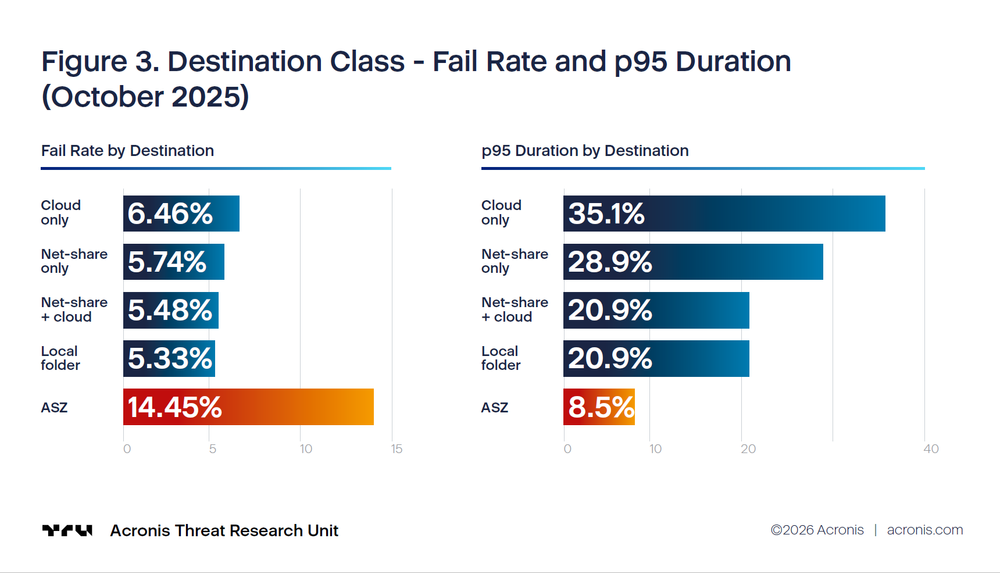
p95 duration varies significantly: cloud-only at 2,106 sec (35 min.) vs. local folder at 1,253 sec (21 min.). The network-share + cloud combination shows a lower p95 than either destination alone, supporting the redundancy benefit.
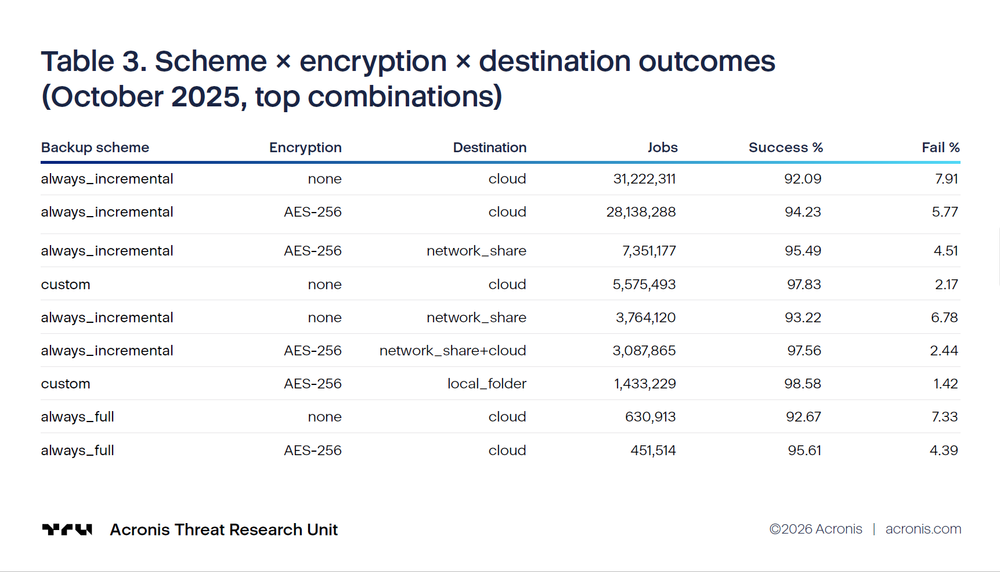
Encryption correlates with better outcomes: AES-256 encrypted always_incremental cloud jobs fail at 5.77% vs. 7.91% for unencrypted. This is not because encryption "fixes" reliability — it’s a proxy for deployment maturity. Encrypted configurations tend to appear in better-governed environments. Custom + AES-256 + local_folder achieves the lowest fail rate (1.42%).
The operational explanation is the nature of dependency chains. Network shares add external dependencies (DNS, routing, SMB / NFS, NAS availability, credentials) that can break persistently. Cloud failures more often look temporary — timeouts or throttling that succeed after retries. This matters because persistent failures create repeated failures night after night, increasing operational load and making collisions more likely.
These findings connect back to the "window illusion" problem: higher p95 values mean that a meaningful share of jobs will regularly run late, and higher fail rates — especially persistent ones — create re-run load that pushes even more jobs into the tail. When many customers share the same infrastructure and scheduling patterns, those tails and reruns collide. The result is the visible symptom customers complain about: backups that are "successful" but finish too late, and fleets that look green in a dashboard while still building recovery risk.
These results should be framed correctly: this is not about any vendor’s product being "good" or "bad." The telemetry shows how backups behave in real customer environments, where outcomes are driven by factors outside the core backup engine — network reliability and latency, storage availability and throughput, authentication and credential hygiene, endpoint performance, schedule design, retention rules and the daily discipline with which people configure and maintain policies. In other words, the product can work as designed while the overall system still produces failures or long runtimes because the environment and the operating model introduce variability and persistent failure modes.
The destination data should be read as an environment-and-policy story. Backups involving network shares tend to be more fragile not because "network share is bad," but because they add a longer dependency chain: connectivity, name resolution, routing, SMB / NFS behavior, NAS uptime, permissions and stored credentials all must be correct at run time. When one of those condition drifts — an expired password, a changed share permission, a moved path or a temporary connectivity issue — the backup job may fail and then keep failing until someone fixes the underlying problem. Cloud-only backups, by contrast, often fail for different reasons, such as timeouts, throttling or quotas, and those issues may clear through retries and backoff.
The scheme / encryption / destination combinations show that configuration maturity matters as much as, or more than any single technical setting. A better reading is that some configurations tend to appear in less governed environments — where monitoring is weaker, credential management is inconsistent and policy drift is more likely — while other configurations cluster in environments with clearer standards, better maintenance routines and better-designed redundancy.
The right industry takeaway is operational: improve policy baselines, reduce unmanaged dependency chains where possible, design schedules for variability, and put people-and-process controls in place that stop small environment changes from turning into repeated nightly failures.
The MSP depth trap
The MSP depth trap describes a nonlinear increase in fail rates as tenant hierarchies become deeply nested. Hierarchy depth is a proxy for administrative complexity: more inheritance layers, more RBAC boundaries and more complex alert routing and exception management.
In the analyzed 2025 dataset (October example), the step-change failure point is at nesting level 12, which shows a 39.78% fail rate across 1,076 tenants. This is a sharp escalation from levels 7–11 which range from 4.81% to 9.50%.
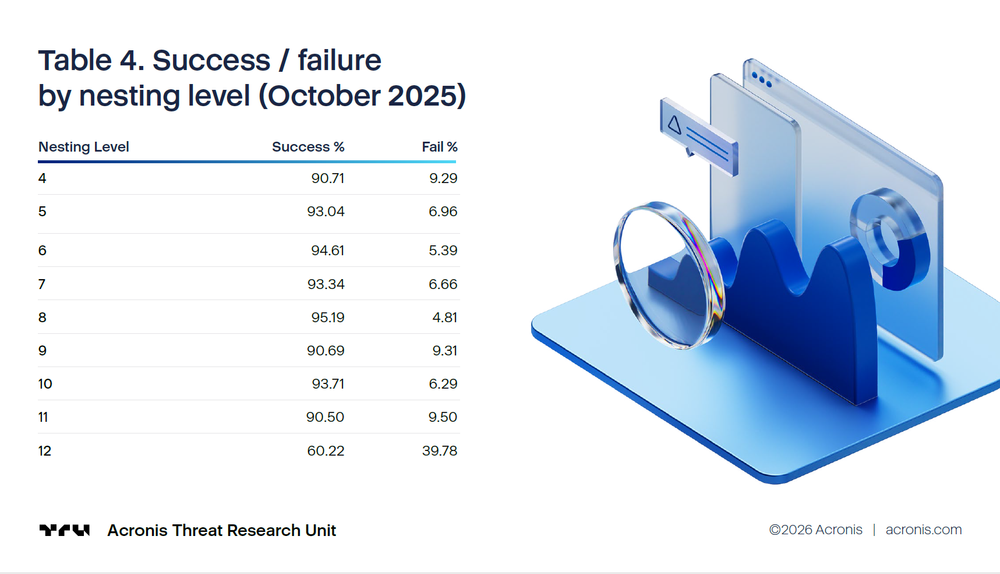
Note: Level 4 (8,849 tenants, 9.29% fail) represents large direct customers with shallow hierarchy, where the elevated fail rate may reflect less MSP oversight.
Why depth becomes a failure multiplier
Several operational mechanisms make deep hierarchies fragile:
- Inheritance drift: Exceptions build up as providers onboard many clients with nonstandard constraints, increasing the chance of misaligned schedules, credentials or retention rules.
- RBAC / authority gaps: Alerts may go to teams without remediation rights, increasing time-to-fix and repeated failures.
- Heterogeneous environments: Destination and network dependencies differ across clients, making standardization harder as depth increases.
- Collision risk: Independent sub-tenants often move toward similar schedules, increasing peak concurrency and amplifying tail effects.
From a customer procurement and governance point of view, this hierarchy pattern translates into requirements that can be checked in contracts and in operations:
- Visibility: Customer-scoped reporting that includes success-in-window, effective recovery point age and restore test results.
- Escalation: Clear ownership and escalation SLAs for overnight failures; documented authority paths.
- Standardization : Defined policybaselines and documented exceptions; regular reconciliation of inherited settings.
- Capacity assurance: Evidence of capacity planning for peak concurrency and tail behavior.
Combined effect: How "green" fleets accumulate risk
The two patterns interact. Long tails create window overruns. Deep hierarchies create monitoring and remediation friction. Together, they can produce a system that looks stable but slowly builds recoverability risk.
A realistic end-customer timeline
1) Backups are scheduled nightly with a window sized around typical (median) behavior.
2) A predictable share of jobs falls into the tail (p95 / p99), causing late completions that still register as success.
3) Late jobs collide with later schedules or morning activity, increasing load and pushing more jobs into the tail (feedback loop).
4) Deep hierarchy delays remediation because alerts, authority and context are spread across layers.
5) During an incident, the most recent recovery points are older than expected or restores take longer than planned.
When these patterns happen together, the risk does not look dramatic day by day — it looks "mostly fine" until it is not. Long-tail behavior means that a predictable share of backups will take much longer than a typical run. Teams naturally size the window around what they see most often (the median), but a meaningful minority of jobs regularly land in the p95 / p99 tail. Those jobs may still finish successfully, so the dashboard stays green, yet they finish late enough to run into business hours and quietly move the real protection point later and later.
That is where the slow drift begins. If a backup expected to finish around 03:00 regularly finishes closer to the start of the business day, the newest usable recovery point at 09:00 is not what people think it is. The schedule may still say "nightly," and the job may still say "success," but the effective RPO has worsened because the latest good copy is older at the moments that matter. Over time, late completions shorten the gap before the next run, creating a tighter turnaround with more contention and more overlap — a feedback loop in which overruns become more frequent, not less.
Deep hierarchies then make this harder to detect and fix. In a heavily nested, multitenant setup, policies inherit in complex ways, exceptions build up, alert routing becomes unclear and the person who gets the alert may not be authorized or equipped to fix the problem. The practical result is not only "more failures," but slower recovery from failures and, in the worst cases, failures that are not surfaced clearly at the tenant level. From an end-customer point of view, this is exactly how a service can look stable overall while their specific environment becomes less recoverable over time — late backups that still show success, intermittent failures that keep repeating and remediation that takes longer because it must move through layers.
A realistic end-customer timeline, therefore, is a gradual mismatch between "what the schedule says" and "what the system actually delivers." Backups are planned around typical behavior, a predictable minority runs long and finishes late while still showing success, late jobs collide with the next cycle and with morning activity and the extra load pushes more work into the tail. When a real incident finally happens — ransomware, a bad change or a major outage — the organization sees the combined effect: recovery points are older than expected, restores take longer than planned, and what looked like "minor nightly noise" becomes a material business impact.
Conclusions
The analyzed Acronis telemetry reinforces a broader industry reality: backup is a continuous operational system. Treating it as a nightly batch job creates hidden exposure.
Reliability is a time-and-distribution problem. Tail ratios of 27–31× and p99 of 11,125 seconds (185 min) in the worst week mean that window planning based on medians systematically understates real operational needs.
Managed scale introduces nonlinear complexity risk. Extreme nesting (level 12) increases failure rates to 39.78% — a step-change reflecting accumulated complexity. Customers experience outcomes without seeing the internal hierarchy that shapes them.
Recommendations
These recommendations are for end customers — whether you run backups yourself or use them through a managed provider.
Define recovery outcomes and measure "success-in-window"
Start by making the outcome explicit: for each workload tier (for example Tier 0/1/2), define a clear completion cutoff that matches what the business needs the next morning. A backup that eventually succeeds but finishes after that cutoff should be treated as an operational problem, not as "all good." Once those cutoffs exist, track them like service levels: the percentage of jobs that finish inside the window and the p95 / p99 completion times for your most critical systems. Pair this with two indicators that are easy to understand and hard to game: the age of the newest usable recovery point (effective recovery point age) and the pass rate of restore tests.
Many mainstream backup ecosystems already support backup windows and policy-like compliance controls, so the main shift is to turn those capabilities into operational KPIs.
Engineer schedules and capacity for tail behavior, not averages
Most backup pain comes from nights when "everything starts at once" and the slowest jobs pull the rest into a queue. Reduce that by staggering start times so jobs do not gather in the same few minutes. Where possible, give heavy workloads their own schedules and, ideally, their own repositories or throughput budgets so they do not dominate everyone else’s window.
Capacity planning should assume difficult nights — patch cycles, end-of-month activity, large data changes — not the calm, average nights. The practical goal is to stop one bad night from creating a chain reaction that pushes more jobs into the tail the next night.
If you use a managed provider, make governance part of the service definition
End customers often receive summary rollups that hide where issues really are. Require reporting that is scoped to your environment and lets you drill down from rollup status into the specific jobs, systems and destinations driving risk.
Also, require an overnight escalation model that is real, not theoretical: clear SLAs, clear ownership and proof that the first responder can either remediate directly or escalate immediately with authority and context. Insist on regular policy reconciliation — an explicit review process that catches inheritance drift, inconsistent schedules and exceptions that have quietly built up over time. Pay special attention if your tenancy is deeply nested (level 9+): the data shows failure rates escalate significantly at extreme nesting depths.
Close "late discovery" with simple operational rituals and thresholds
A major driver of customer dissatisfaction is finding problems only after business hours begin. The most effective fix is simple: implement an after-window check so any job that finishes after the cutoff triggers review even if it technically succeeded.
Use tiered alerting so truly critical systems page humans while lower-tier issues create tickets; this reduces alert fatigue and increases the chance that the right signals are acted on. Then make a short daily morning review standard practice, covering overnight failures, late completions, retries and backlog. It is a small habit, but it stops slow drift from turning into accumulated risk.
Treat restore readiness as a continuous practice, not an annual exercise
Backups are only valuable if restores work under realistic conditions. Run restore tests regularly; sampling is fine as long as it is consistent and covers critical workload types. Record not only "pass / fail," but also time-to-restore and verification results so you can see whether recovery is getting slower over time. Keep recovery documentation current — dependencies, credentials, runbooks — and verify that it is available when systems are degraded.
Where it fits your risk profile, keep offline or logically isolated copies and test restores from those paths as well. Industry guidance on ransomware resilience clearly emphasizes having offline backups and regularly testing availability and integrity.