


Executive summary
Patch management is one of the most effective security controls that reliably reduces known risk. It is also one of the hardest disciplines to execute consistently in small business environments. Updates compete with uptime and end-user disruption, endpoints disappear off of the network, line-of-business applications resist change and every reboot prompt is a negotiation. For MSPs, patching is where security expectations, SLA commitments and day-to-day operational noise collide.
This report summarizes patch deployment behavior observed in Acronis telemetry during the second half of 2025. It focuses on patching for Microsoft and third-party applications, and on the real issue MSPs deal with every day: Not whether patching can be done, but how fast patches are actually applied across all devices — especially the slowest devices, which create the most risk and support cost.
Globally, the median time to install Microsoft patches is 185 hours (7.7 days), while the 90th percentile reaches 926 hours (38.6 days). Third-party patches install faster on median at 136 hours (5.7 days) but still show a long tail with a P90 of 597 hours (24.9 days).
Public benchmarks typically describe patch / vulnerability remediation in weeks (e.g., ~17–40 days in large telemetry studies, and ~55 days to remediate half of KEV-class issues). Using Acronis telemetry, we measure patch-to-install latency directly and see a median in single-digit days, while the long tail still extends into multiple weeks — consistent with the “long-tail” challenge shown in external research.
How to read the metrics in this report
This report uses a few statistical terms to describe patching behaviour across many organizations. Here’s what they mean:
- Median (P50): The “typical” result. If the median time-to-install is seven days, that means half of patch deployments finished in seven days or less, and half took longer. Medians are useful because they aren’t overly affected by a few extreme outliers.
- P90 (90th percentile): The “long tail” result. If the P90 time to install is 45 days, that means 90% of deployments finished in 45 days or less, and the slowest 10% took longer than 45 days. Why it matters: Security incidents and MSP escalations often come from this slowest segment — the devices that miss maintenance windows, stay offline or never reboot.
- Status mix (how patches are categorized in telemetry):
o New / Pending: The patch is detected but not installed yet. Think of this as backlog in the pipeline.
o Installed: The patch was successfully applied.
o Reboot required: The patch is effectively applied, but needs a restart to finish. Because many updates aren't fully complete until a restart happens, any endpoint that delays reboot stays in a "restart required / waiting to restart" state longer — and Microsoft notes this can extend deployment time dramatically (even indefinitely), which is exactly what creates a long tail in time to install.
o Failed: An installation was attempted but didn't succeed.
o Obsolete: The patch became superseded (replaced by a newer update) or is no longer applicable by the time it was evaluated.
Important: "Obsolete" doesn't always mean "ignored," but a high obsolete share can indicate bursty patching (catch-up waves) rather than a steady cadence.
- “Tail risk”: A practical way to talk about the operational and security impact of slow patching. When P90 is very high, a meaningful slice of devices stays exposed for weeks or months.
- Microsoft vs. third-party patches:
o Microsoft patches typically include Windows and Microsoft components and often involve more cautious scheduling and reboots.
o Third-party patches cover applications (browsers, PDF tools, collaboration apps, remote tools, etc.) which are frequently targeted and often patched differently.
Why patch management matters for SMBs and MSPs
For SMBs, patching is the difference between being protected against yesterday's bug and being exposed to it. Once vulnerabilities are disclosed, exploitation can become industrialized: Scripts, opportunistic scanning and commodity toolkits can appear quickly. SMBs rarely have deep compensating controls such as dedicated vulnerability engineering teams or 24/7 security operations, so patch latency becomes a central determinant of their exposure window.
For MSPs, patch management is also a business system. Slow patch cycles drive reactive work: Escalations after headline vulnerabilities, after-hours remediation and recurring tickets from devices that remain pending for weeks. Better patch cycles shift effort earlier: Safe testing, staged rollouts, predictable maintenance windows and reboot orchestration. The goal is not to patch instantly; it’s to patch predictably and to keep the lagging segment from turning into a permanent backlog.
Global snapshot: Backlog is the default
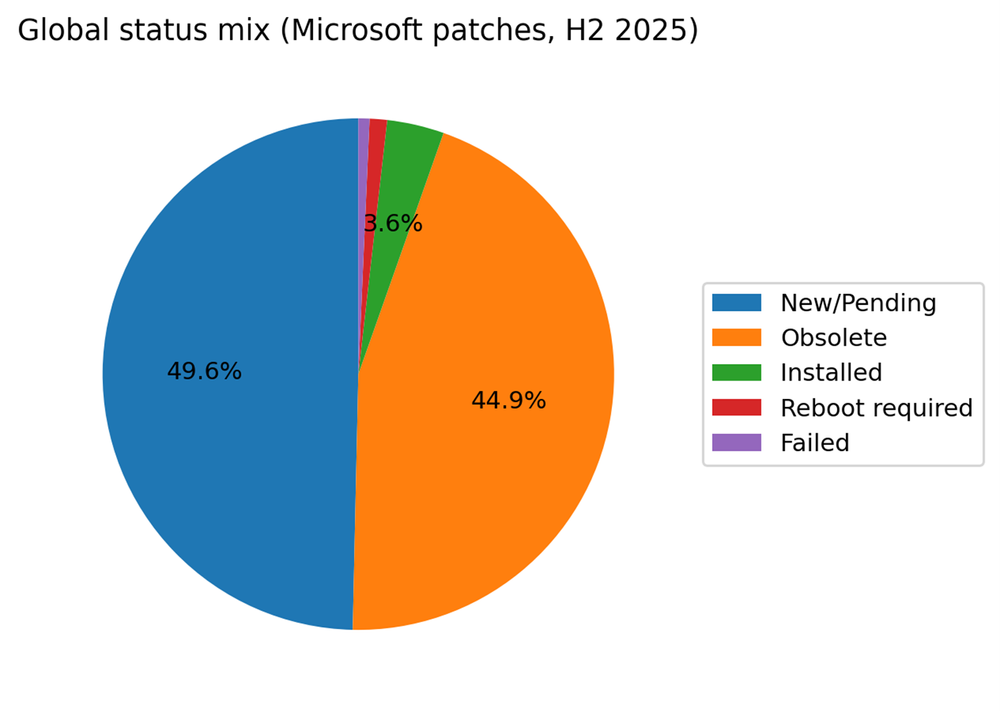
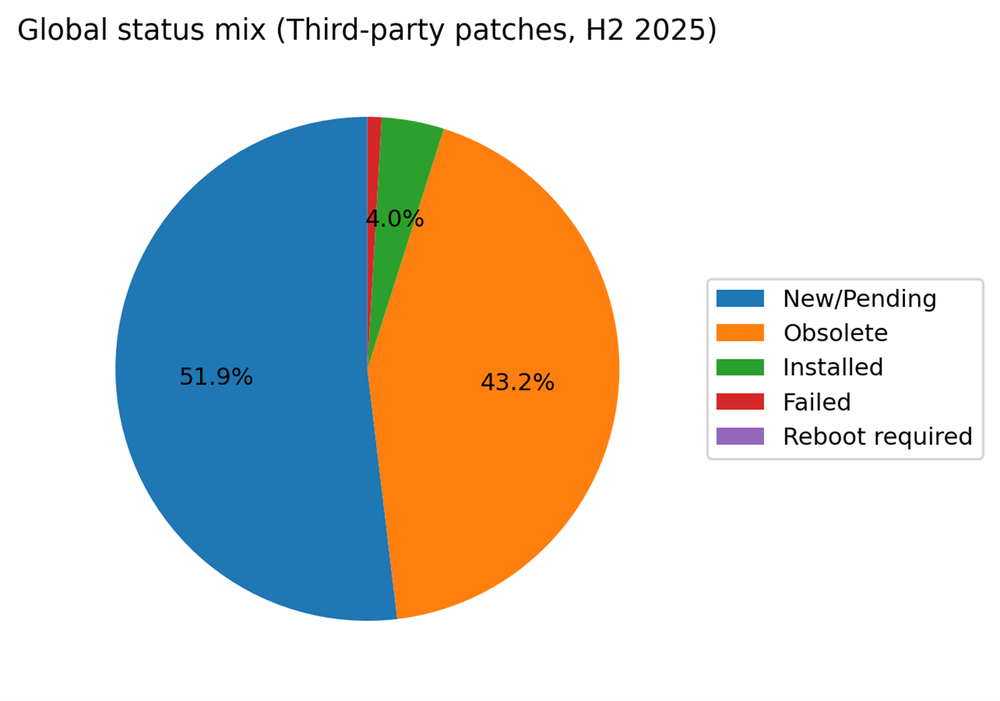
In the global snapshot for H2 2025, Microsoft patches are most often observed as New / Pending (49.6%) or Obsolete (44.9%). Only 3.6% are recorded as Installed, with 1.1% in Reboot required and 0.7% failed. Third-party patches show a similar shape: New / Pending at 51.9% and Obsolete at 43.2%, with 4.0% installed.
A common mistake is to interpret low-installed share as proof that organizations never patch. Current-state telemetry captures a moving stream of patch candidates: As patch catalogs advance, older candidates become obsolete and are replaced. However, the combination of roughly half the population remaining pending and a very large obsolete share is a clear operational signal: Many environments are not continuously closing patch work. They are periodically catching up.
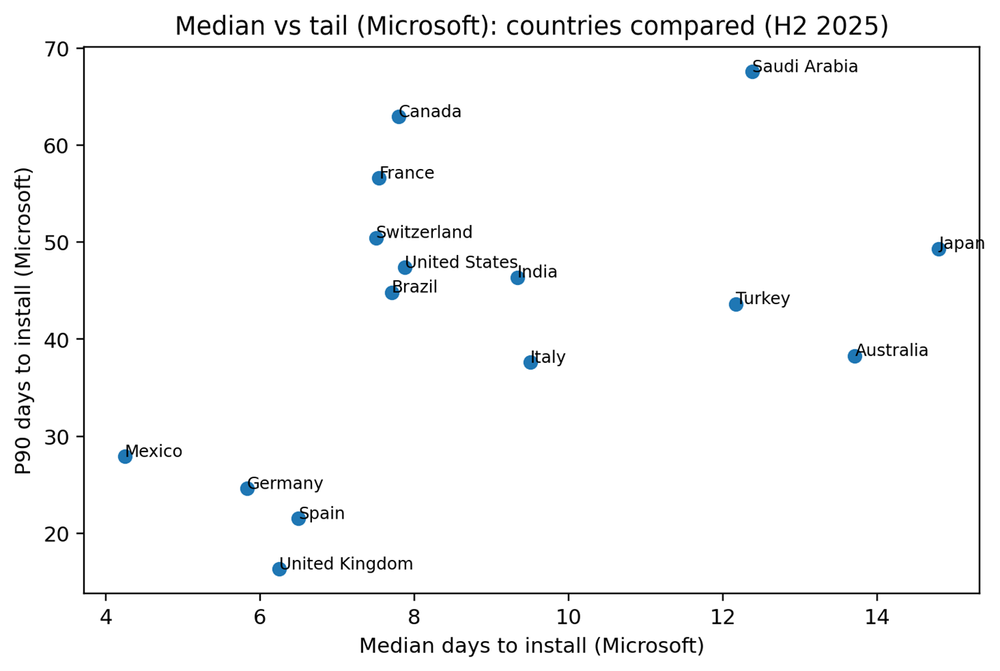
Country comparison: Typical speed vs. tail risk
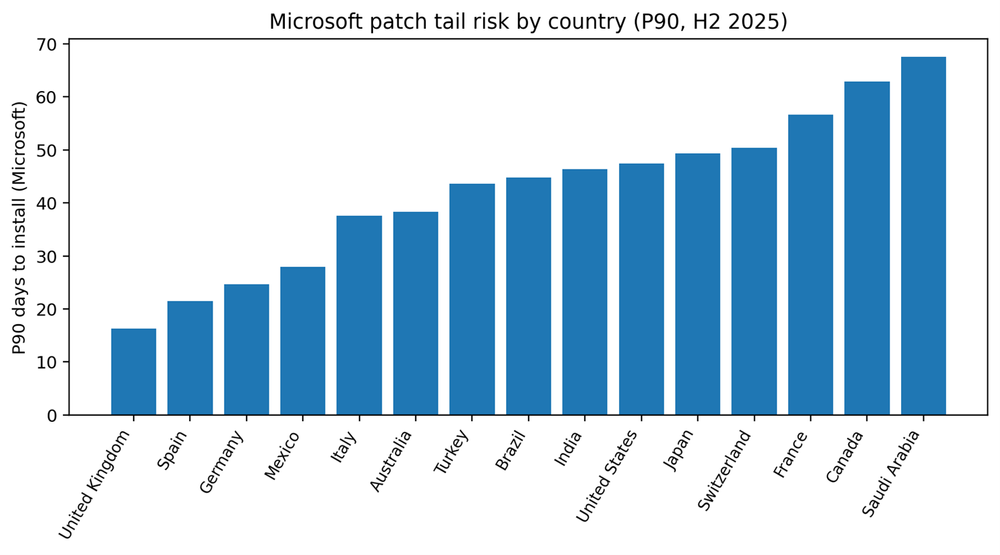
Country medians vary widely, from about four days to nearly fifteen days for Microsoft patches. But the more important variation is in the tail. Some markets show a compressed tail, meaning even laggards converge within a few weeks. Others show P90 values measured in two months, which implies that a meaningful segment of endpoints is not being reached or completed through routine processes.
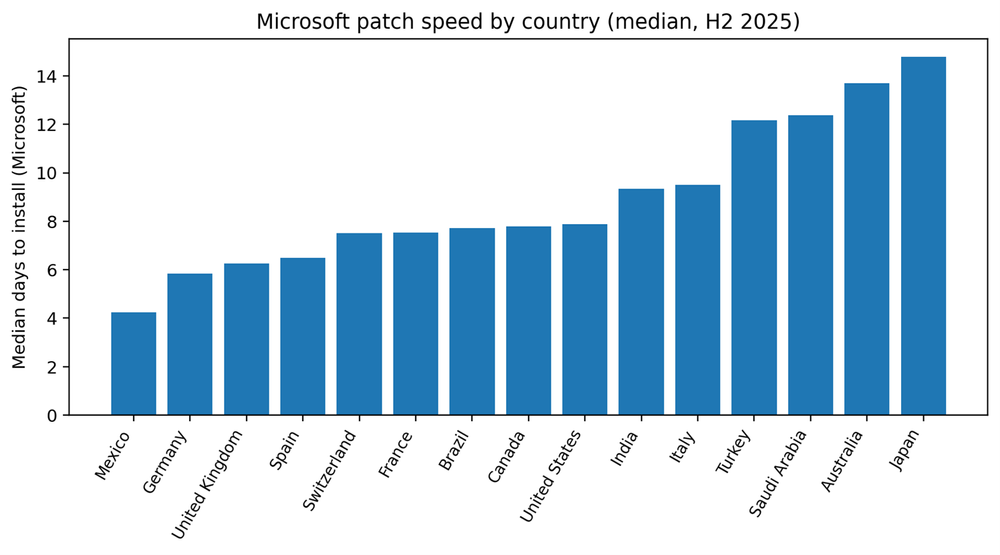
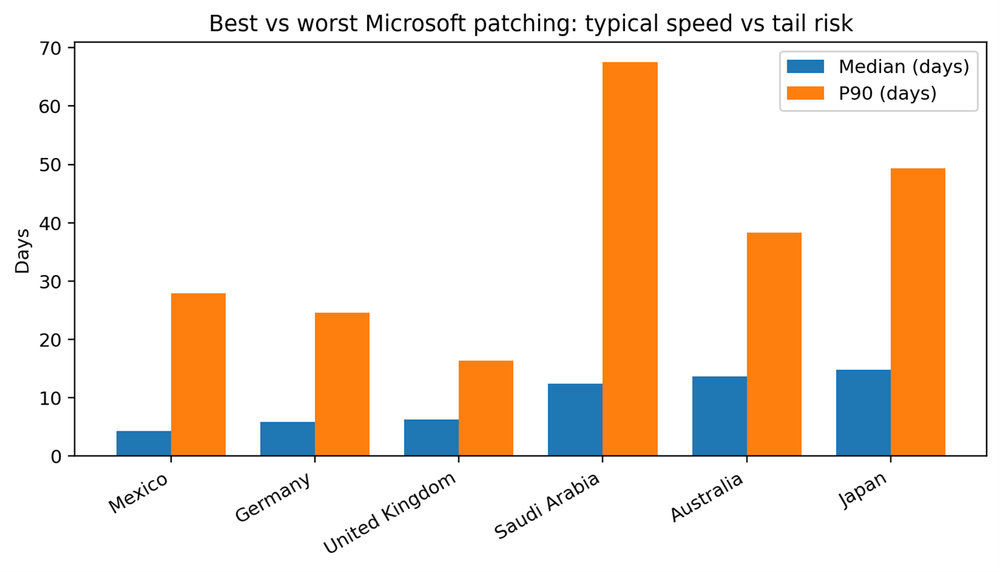
What the fastest markets do differently
The fastest median performers for Microsoft patches in this dataset are Mexico, Germany, United Kingdom and Spain. Fast medians often correlate with standardized fleets and clear maintenance windows. But speed alone is not the full story. The most valuable capability is controlling the tail — ensuring the laggards do not drift for months.
Tail control usually requires a few operational moves: Endpoints consistently check in, reboot completion is treated as policy rather than preference, and a weekly exceptions process turns “stale pending” into active remediation work.
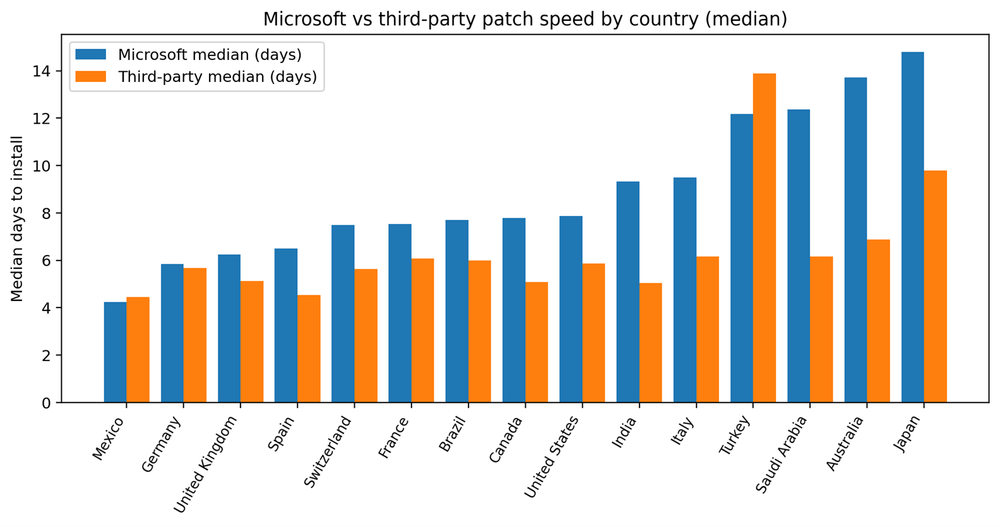
Microsoft vs. third party: Where friction lives
Third-party patching is usually faster than Microsoft patching, and the gap between them is a useful diagnostic. A large gap often means the organization can update applications quietly but struggles with OS-level disruption, approvals, or reboot coordination. A small gap can mean either strong OS discipline or weak application discipline. The only safe interpretation is to track both explicitly and treat third-party patching as a first-class exposure surface.
Country benchmarks (tables)
Table 1. Microsoft patching by country
Table 2. Third-party patching by country
Recommendations: How to shrink the tail without breaking clients
The global numbers suggest patching is constrained less by technical failure and more by operational throughput. That is good news: Throughput can be engineered. The MSPs that win at patching do not simply “push harder.” They build a service model that absorbs risk, limits disruption and makes exceptions visible.
Manage patching to the tail, not the average. Median patch time tells you how the typical endpoint behaves; P90 tells you whether you have a backlog segment that will drive incident exposure and support tickets. Operationalize a weekly tail review: Endpoints with pending patches older than your SLA threshold, endpoints stuck in reboot required and endpoints that repeatedly miss maintenance windows. Treat this as a queue with owners and outcomes, not a dashboard you glance at once a month.
Make reboot completion a first-class workflow. In many SMB environments, reboots are treated as user preferences, which produces predictable long tails. A mature service defines reboot behavior: User notifications, limited deferral windows and a forced reboot schedule for persistent deferrers. Most clients accept reboots when they are predictable, communicated and scheduled around business peaks.
Adopt staged rollouts by default. Staged rollouts reduce the primary reason patching is delayed: fear of breaking business applications. A practical approach is a pilot ring (5%–10% of endpoints), then a broader rollout, then the remainder. Over time, staged rollouts reduce blanket delays and build trust with end users because updates feel controlled rather than risky.
Report OS and application patching separately. Application vulnerabilities are a common entry point. If clients only see OS compliance, they can overestimate their safety. Reporting Microsoft and third-party medians and tails side by side helps clients understand why maintenance windows and reboot policy matter.
Standardize what you can and monitor what you cannot. Faster environments tend to have fewer bespoke configurations, higher agent health and clearer maintenance windows. Enforce endpoint check-in requirements for laptops, monitor agent health continuously and treat “unreachable devices” as an operational incident until resolved.
Conclusion
Acronis H2 2025 telemetry reflects a patching reality MSPs recognize: Backlog is common, obsolescence is high and the median organization takes roughly a week to install Microsoft patches. The differentiator is tail control. When P90 stretches to 50–60 days, attackers get months of opportunity against known weaknesses, and MSPs inherit a perpetual stream of exceptions and escalations.
The encouraging signal is that outright failure remains low. Most environments can patch successfully when they attempt it. That means the biggest improvements are operational, not technical: staged rollouts, reboot discipline, endpoint reachability and an explicit process for the stale segment. MSPs that implement these practices can convert patching from a noisy cost center into a measurable service.
The most actionable next step is to segment your own tenant base the same way this report implicitly does: the median group and the tail group. Your median devices will largely move with automation. Your tail devices require a different playbook — and they are the ones that determine your real risk and your real support cost.