Operations
The Operations dashboard provides a number of customizable widgets that give an overview of operations related to the Cyber Protection service. Widgets for other services will be available in future releases.
By default, the data is displayed for the tenant in which you are operating. You can change the displayed tenant individually for each widget by editing it. Aggregated information about the direct child customer tenants of the selected tenant is also shown, including those that are located in folders. The dashboard does not display information about child partners and their child tenants; you must drill-down into the specific partner to see its dashboard. However, if you convert a child partner tenant to a folder tenant, the information about this tenant's child customers will appear on the parent tenant's dashboard.
The widgets are updated every two minutes. The widgets have clickable elements that enable you to investigate and troubleshoot issues. You can download the current state of the dashboard in the .pdf or/and .xlsx format, or send it via email to any address, including external recipients.
You can choose from a variety of widgets, presented as tables, pie charts, bar charts, lists, and tree maps. You can add multiple widgets of the same type for different tenants or with different filters.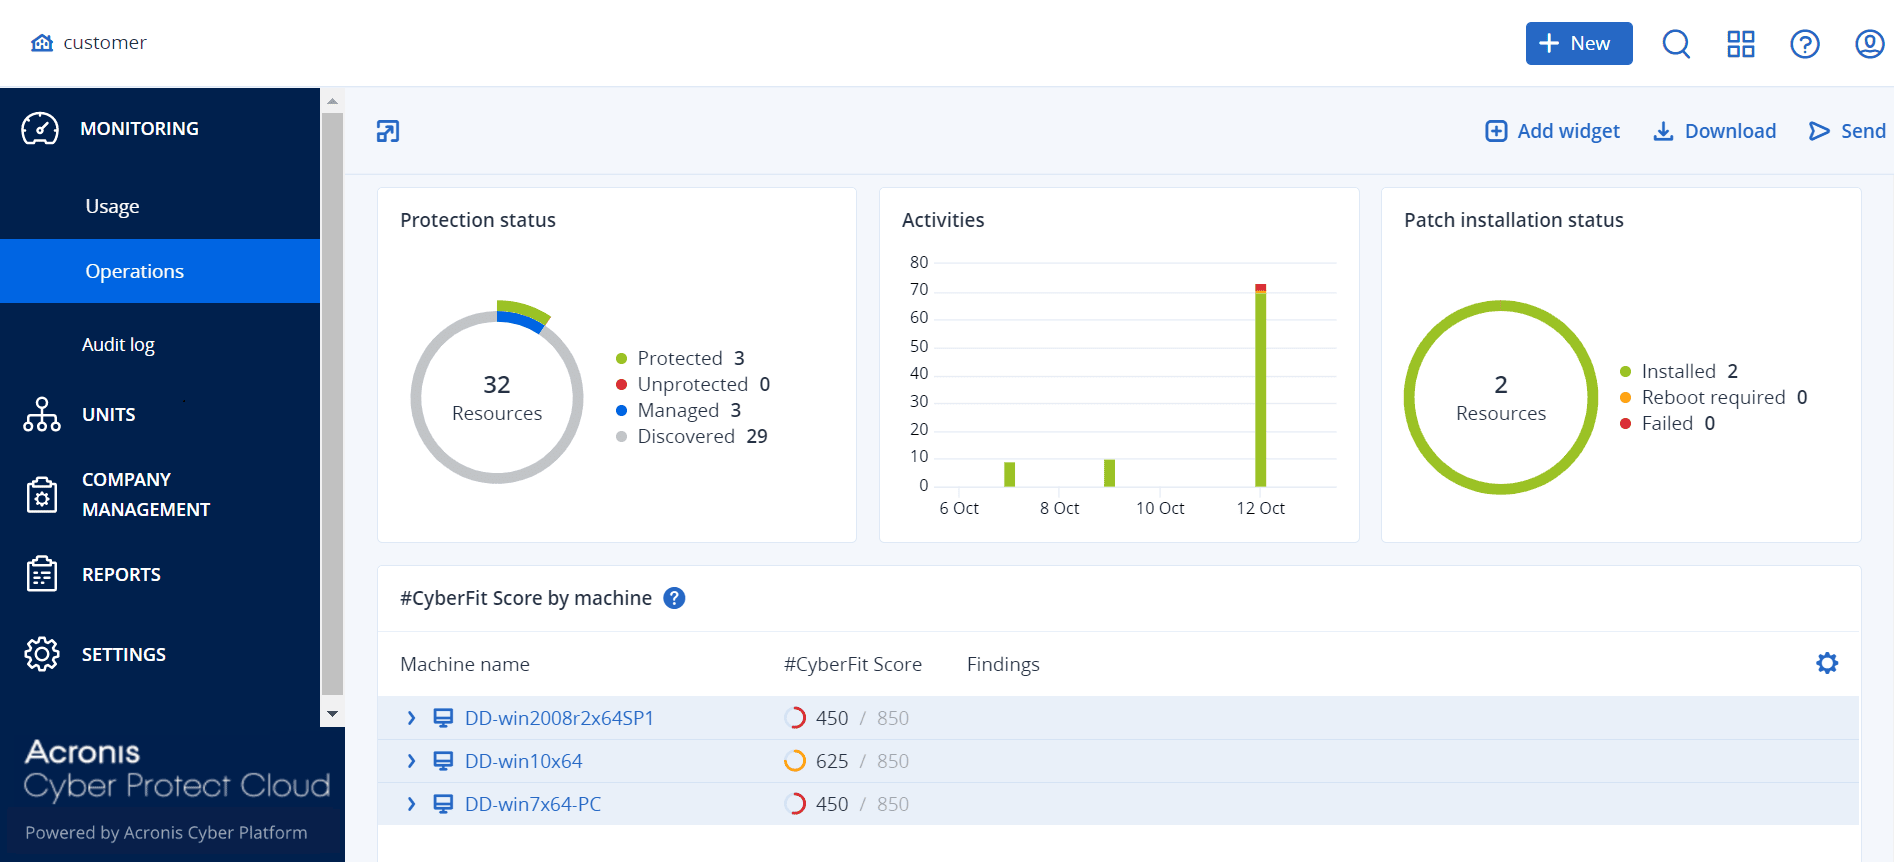
To rearrange the widgets on the dashboard
Drag and drop the widgets by clicking on their names.
To edit a widget
Click the pencil icon next to the widget name. Editing a widget enables you to rename it, change the period of time, select the tenant for which the data is displayed, and set filters.
To add a widget
Click Add widget, and then do one of the following:
- Click the widget that you want to add. The widget will be added with the default settings.
- To edit the widget before adding it, click the gear icon when the widget is selected. After editing the widget, click Done.
To remove a widget
Click the X sign next to the widget name.