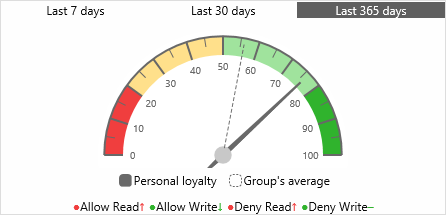
User loyalty indicator
The card displays a number of indicators summarizing the statistics of user actions for the reporting period in order to identify anomalies or suspicious activity. These indicators constitute an indicator of user loyalty (normality). The loyalty indicator helps detect suspicious user activity and anomalies by indicating deviation of user behavior from a well-determined baseline.
The user activity baseline is determined as the average level of the user’s activity for a certain period preceding the reporting period. The duration of this baseline period varies depending upon the reporting period. The indicator compares the average levels of activity during the reporting period with the baseline to identify changes to user behavior, and to determine whether they are acting typically (the indicator is closer to 100%) or abnormally (the indicator is closer to 0%). Possible options for the reporting period: the last 7, 30, or 365 days before the current date.
The duration of the period on which the user activity baseline is determined varies depending upon the selected reporting period:
Reporting period | Baseline period |
Last 7 days | Either 12 valid 7-day intervals before the reporting period, or all days registered in the logs before the reporting period if less than 12 such 7-day intervals are registered. |
Last 30 days | Either 12 valid 30-day intervals before the reporting period, or all days registered in the logs before the reporting period if less than 12 such 30-day intervals are registered. |
Last 365 days | Either 2 valid 365-day intervals before the reporting period, or all days registered in the logs before the reporting period if less than 2 such 365-day intervals are registered. |
Only intervals with nonzero user activity are considered valid. For the 7- and 30-day reporting periods, the search for such intervals is limited to the last year before the reporting period. If no valid intervals can be found for the baseline period or no user activity has been registered for the reporting period, the indicator displays “Insufficient data”.
To determine the activity levels, the indicator determines the average numbers of actions that were denied and allowed by the DeviceLock Service, and then it calculates the percentage and direction of changes in these numbers compared to the baseline. The overall result is displayed on the loyalty indicator, characterizing changes in the current activity level compared to the baseline. A higher overall result indicates better compliance with the DeviceLock security policies.
The indicator is complemented by a dashed hand showing the group’s average value, which provides the ability to compare the user’s personal loyalty index to the average index of their coworkers group. For further details, see
Group average loyalty index.
The loyalty indicator also includes refinement indicators that specify the contribution of different types of user activity to the change in the overall result:
•Allow Read - The allowed attempts to receive data.
•Allow Write - The allowed attempts to send data.
•Deny Read - The denied attempts to receive data.
•Deny Write - The denied attempts to send data.
•Career Search - The attempts to use job search websites.
A refinement indicator is displayed only if the level of the respective user activity has changed. Thus, the Career Search indicator appears when there is a change in the level of activity associated with the use of job search websites. The Allow Read/Write or Deny Read/Write indicators appear when the average number of allowed or denied data exchange attempts has changed.
For each of the refinement indicators (except for Career Search), the following notation is used for how it changed in the reporting period compared to the baseline:
•Up arrow, red - An increase in the number of allowed or denied attempts.
•Down arrow, green - A decrease in the number of allowed or denied attempts.
•Vertical bar, red - A constant non-zero number of allowed or denied attempts.
•Vertical bar, green - A constant number of allowed attempts and no denied attempts.
•Long dash, green - No allowed / denied attempts, which led to an increase in the overall loyalty indicator.
Group average loyalty index
In addition to the user’s personal loyalty index, the indicator presents the average loyalty index for the group of which this user is a member. The group average index is an average of the loyalty indexes for the group member users. When calculating the group average, the boundary values of the source data are truncated to prevent distortion due to the highest and lowest indexes.
The group average serves to compare the user’s personal loyalty index to the average index of their coworkers group. An abnormal deviation of the personal loyalty index from the group’s average may indicate a suspicious user activity. This is the case, for example, when the group average is in the green area whereas the user’s loyalty index is not.
The group average is shown by a dashed hand in the same diagram as the user’s loyalty indicator. This design helps to compare the current user’s personal index with the group average.
The group average value depends upon the group in which the user is selected. Note that in order to select a user, you must first expand a group, and then select a user from that group. The indicator displays the average for the group from which the user is selected.
Since the user can be a member of multiple groups, the group’s average value may vary depending upon how the user is selected. For example, if a user is selected from the list of members of the built-in group All, the group’s average value is the average by all users registered with the server’s logs. If you select a user from the list of members of a custom group, the group’s average value is the average by the member users of that group.

