Working with the Incident Graph (XDR)
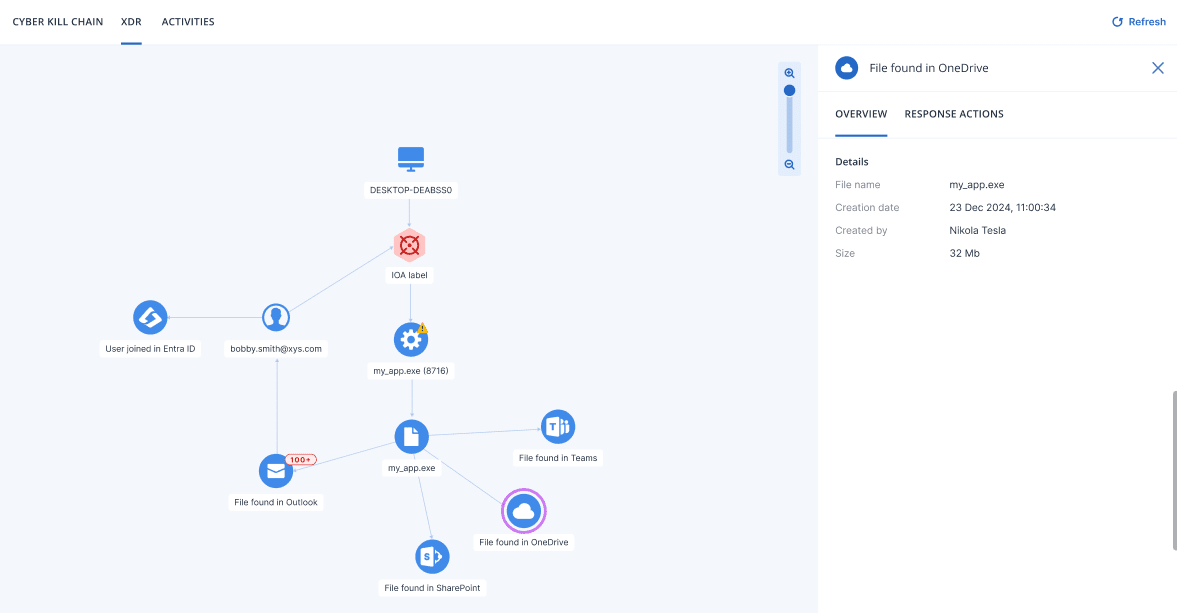
When XDR is enabled, the Incident Graph extends the baseline EDR visualization with external nodes sourced from active XDR integrations, such as identity, email, and firewall data. These external nodes provide additional context about the threat and which external accounts or services were involved.
External nodes appear in the Incident Graph only when XDR integrations are active. Without active integrations, the Incident Graph displays the EDR baseline view. For more information, see Working with the Incident Graph (EDR).
The type of external nodes shown in the graph depends on the active XDR integrations. When integrated with email security, the graph shows email nodes and attachment nodes. When integrated with identity management, the graph shows identity nodes linked to processes on the affected workload. When integrated with Microsoft 365 services, the graph shows collaboration application nodes such as Teams, OneDrive, and SharePoint.
For more information about node icons, see Incident Graph icons.
Use the Incident Graph to:
- Investigating individual nodes
- Applying response actions to integration nodes
- Viewing XDR integration errors
To access the Incident Graph, go to Protection > Incidents, click the relevant incident, and then click the Incident Graph tab.
To refresh the contents of the Incident Graph, click  .
.