When deploying a web application in production, setting up and configuring monitoring is a critical part of the process. As a DevOps, Web developer, or an IT administrator, you need to be alerted when performance issues or incidents occur, and be able to find the root cause of the problem to quickly get it fixed.
There are numerous methods and levels of web applications monitoring – from simple reachability tests to sophisticated code-level diagnostics of distributed apps. In this article, we’ll cover an approach that is
- Quick and easy to implement,
- Can be applied to almost any web application technology stack,
- Complete and applicable to a vast majority of common problems.
Three levels of web application monitoring
The monitoring framework consists of three levels with multiple types of monitors.
- External website monitoring
- Application level monitoring
- Server (OS) level monitoring
When dealing with web applications (especially complex and distributed), the health of the entire system depends on the performance of many individual application components. Any problem in the IT system must be tracked down in order to identify the root cause. For example, a slow response time (website monitoring level) can be caused by database performance problems, which may be the result of a high CPU load.
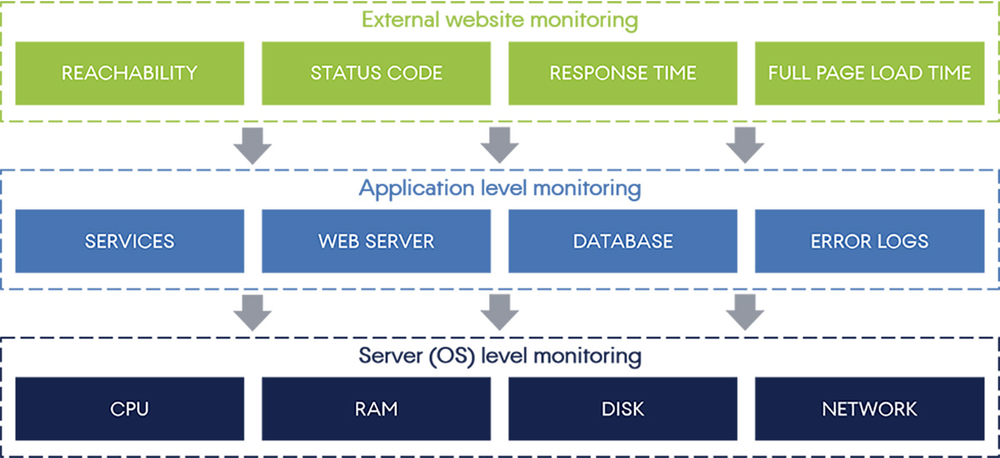
The three levels of web application monitoring.
External website monitoring
External website monitoring, in our case, is a set of metrics that represent how the system performs from an end-user perspective. This set of metrics is collected via an external approach (outside the system) from a few geographical locations. It is a good practice to:
- Constantly check your applications from multiple geographical locations,
- Setup monitoring for all critical URLs and domains used by your application.
There are four basic monitoring types:
- Reachability monitoring is the most basic check to ensure the server simply responds to external requests. If server does not respond – it can be counted as an outage.
- Status code monitoring has the purpose of ensuring the web server responds with a proper HTTP status code (“200” in most cases).
- Response time monitoring shows how much time it takes for a web server to respond to a client’s request. By creating thresholds, you can always know that the server is not just available, but performs well.
- Full-page load-time monitoring is not as critical as reachability, but as you probably know, today’s customers have very high expectations on how long it takes for a web page to load – so you need to ensure it’s always below your specified threshold. Also, page load time can differ significantly depending on a region.
Application level monitoring
Application level monitoring uses an agent-based approach to collect and store data from an application stack perspective (application, web server, database). Application level data and notifications can help troubleshoot problems before they impact end users or third-party systems.
- Service uptime monitoring is a process of checking that the critical services (web server, databases, micro-services, etc.) are running using an agent-based approach (from inside the operating system).
- Web server performance monitoring – a number solution-specific (e.g. Apache or NGINX) performance metrics. For instance, these are the Apache metrics collected via Acronis Monitoring Service: Aggregated CPU and memory consumption of all Apache processes Number of busy and idle workers Average number of requests per second Average number of KB served per second Average number of KB per request CPU usage by all workers
- Database performance monitoring – a number of solution-specific (e.g. MySQL or Cassandra) performance metrics.
- Error logging and monitoring of log files – the idea is simple: you store information about application-specific errors in log files, and then a monitoring system periodically parses these files and notifies you when a certain condition occurs.
Server (OS) level monitoring
In our framework, this level of monitoring is in charge of collecting data on how the infrastructure resources perform when serving the application. The following metrics are suggested as most critical:
- CPU monitoring: CPU usage is the percentage of time that the CPU is busy. CPU load in the most simplistic definition is a CPU queue length. CPU load works perfectly in conjunction with CPU usage in many cases. For example, your system can perform badly even with CPU usage much less than 100 percent, but CPU load with the number of processes in queue will declare the problem.
- RAM monitoring: Free physical memory monitoring can help to avoid performance degradation problems related to RAM.
- Disk monitoring: Free disk space – with a little disk space you are very likely to face performance issues, so it’s better to set thresholds that will alert you when you reach a certain free memory limit (e.g. 20 GB) and increase it as soon as possible. Disk usage monitoring can help you identify when the workload of the server becomes too intensive for the current disk I/O capabilities.
- Network monitoring: Traffic, packets, and errors monitoring across network interfaces allows you to avoid performance bottlenecks, and to know actual and historical network usage statistics.
Setting up web application monitoring with Acronis Monitoring Service
Acronis Monitoring Service is a really easy-to-use, yet complete SaaS-based IT infrastructure monitoring solution, that can handle most of the aspects of web application monitoring, including everything described above (including dependencies modelling). The following table shows how specific monitors of the system correspond to the monitoring types of the framework:
Setting up the monitoring framework described in this article, with Acronis Monitoring Service, can take less than an hour. Try it yourself for free and contact Support in case of any questions or issues.
About Acronis
A Swiss company founded in Singapore in 2003, Acronis has 15 offices worldwide and employees in 50+ countries. Acronis Cyber Protect Cloud is available in 26 languages in 150 countries and is used by over 21,000 service providers to protect over 750,000 businesses.