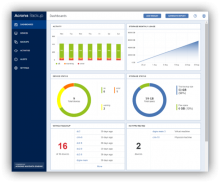
IT administrators like you have tons of important production-oriented tasks every day — managing servers, endpoints, hardware, networks, and more. In this high-speed cycle, a data protection solution is a form of insurance, and you expect it to help you, not make your life more complex.
If you have 15, 50, or 500 systems to manage and protect, you expect to spend as little time as possible to check if everything is OK with the data protection, or if something went wrong. You definitely do not plan to scan numerous logs and reports, checking if some single system failed to back up.
With new dashboards of Acronis Backup 12.5 Advanced, you don’t have to.

Once you open the touch-friendly, web-based console, you will see the dashboard that shows the status of data protection for your entire environment. Moreover, you can:
- Drill down to the exceptions – click on the red (error) or yellow (warning) section of any diagram, and get directly to the list of devices, logs, activities, or storage that is shown on the diagram
- Customize the dashboard – add and remove widgets, set parameters, show only specific groups or filter the data
- Generate reports based on the widgets
In short, in just a few clicks you will understand what precisely is not working, and fix it. By focusing on exceptions, you can save a lot of time – and have it available for primary business tasks.
READ MORE:
About Acronis
A Swiss company founded in Singapore in 2003, Acronis has 15 offices worldwide and employees in 60+ countries. Acronis Cyber Platform is available in 26 languages in 150 countries and is used by over 21,000 service providers to protect over 750,000 businesses.


